Avon 2013 Annual Report Download - page 75
Download and view the complete annual report
Please find page 75 of the 2013 Avon annual report below. You can navigate through the pages in the report by either clicking on the pages listed below, or by using the keyword search tool below to find specific information within the annual report.-
 1
1 -
2
-
3
-
4
-
5
-
6
-
7
-
8
-
9
-
10
-
11
-
12
-
13
-
14
-
15
-
16
-
17
-
18
-
19
-
20
-
21
-
22
-
23
-
24
-
25
-
26
-
27
-
28
-
29
-
30
-
31
-
32
-
33
-
34
-
35
-
36
-
37
-
38
-
39
-
40
-
41
-
42
-
43
-
44
-
45
-
46
-
47
-
48
-
49
-
50
-
51
-
52
-
53
-
54
-
55
-
56
-
57
-
58
-
59
-
60
-
61
-
62
-
63
-
64
-
 65
65 -
 66
66 -
 67
67 -
 68
68 -
 69
69 -
 70
70 -
 71
71 -
 72
72 -
 73
73 -
 74
74 -
 75
75 -
 76
76 -
 77
77 -
 78
78 -
 79
79 -
 80
80 -
 81
81 -
 82
82 -
 83
83 -
 84
84 -
 85
85 -
86
-
87
-
88
-
89
-
90
-
91
-
92
-
93
-
94
-
95
-
96
-
97
-
98
-
99
-
100
-
101
-
102
-
103
-
104
-
105
-
106
-
107
-
108
-
109
-
110
-
111
-
112
-
113
-
114
-
115
-
116
-
117
-
118
-
119
-
120
-
121
-
122
-
123
-
124
-
125
-
126
-
127
-
128
-
129
-
130
 |
 |
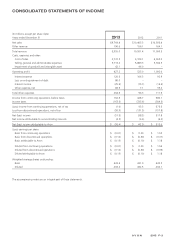
CONSOLIDATED BALANCE SHEETS
(In millions, except per share data)
December 31 2013 2012
Assets
Current Assets
Cash, including cash equivalents of $576.2 and $762.9 $ 1,107.9 $ 1,206.9
Accounts receivable (less allowances of $147.2 and $161.1) 676.3 752.1
Inventories 1,005.6 1,101.1
Prepaid expenses and other 689.3 827.0
Current assets of discontinued operations – 41.8
Total current assets $ 3,479.1 $ 3,928.9
Property, plant and equipment, at cost
Land 55.3 62.9
Buildings and improvements 1,085.3 1,146.0
Equipment 1,343.9 1,475.9
2,484.5 2,684.8
Less accumulated depreciation (1,091.2) (1,158.8)
1,393.3 1,526.0
Goodwill 282.5 330.3
Other intangible assets, net 33.5 40.6
Other assets 1,303.9 1,407.9
Noncurrent assets of discontinued operations – 148.8
Total assets $ 6,492.3 $ 7,382.5
Liabilities and Shareholders’ Equity
Current Liabilities
Debt maturing within one year $ 188.0 $ 572.0
Accounts payable 896.5 914.3
Accrued compensation 271.2 264.7
Other accrued liabilities 652.6 645.3
Sales and taxes other than income 186.8 210.6
Income taxes 45.4 73.6
Current liabilities of discontinued operations – 24.1
Total current liabilities 2,240.5 2,704.6
Long-term debt 2,532.7 2,623.8
Employee benefit plans 398.0 637.6
Long-term income taxes 53.3 52.0
Other liabilities 140.3 131.1
Noncurrent liabilities of discontinued operations – 0.1
Total liabilities $ 5,364.8 $ 6,149.2
Commitments and contingencies (Notes 14 and 16)
Shareholders’ Equity
Common stock, par value $.25 – authorized 1,500 shares; issued 748.8 and 746.7 shares $ 189.4 $ 188.3
Additional paid-in capital 2,175.6 2,119.6
Retained earnings 4,196.7 4,357.8
Accumulated other comprehensive loss (870.4) (876.7)
Treasury stock, at cost (314.9 and 314.5 shares) (4,581.2) (4,571.9)
Total Avon shareholders’ equity 1,110.1 1,217.1
Noncontrolling interests 17.4 16.2
Total shareholders’ equity $ 1,127.5 $ 1,233.3
Total liabilities and shareholders’ equity $ 6,492.3 $ 7,382.5
The accompanying notes are an integral part of these statements.
A V O N 2013 F-5