Avon 2013 Annual Report Download - page 109
Download and view the complete annual report
Please find page 109 of the 2013 Avon annual report below. You can navigate through the pages in the report by either clicking on the pages listed below, or by using the keyword search tool below to find specific information within the annual report.-
 1
1 -
2
-
3
-
4
-
5
-
6
-
7
-
8
-
9
-
10
-
11
-
12
-
13
-
14
-
15
-
16
-
17
-
18
-
19
-
20
-
21
-
22
-
23
-
24
-
25
-
26
-
27
-
28
-
29
-
30
-
31
-
32
-
33
-
34
-
35
-
36
-
37
-
38
-
39
-
40
-
41
-
42
-
43
-
44
-
45
-
46
-
47
-
48
-
49
-
50
-
51
-
52
-
53
-
54
-
55
-
56
-
57
-
58
-
59
-
60
-
61
-
62
-
63
-
64
-
65
-
66
-
67
-
68
-
69
-
70
-
71
-
72
-
73
-
74
-
75
-
76
-
77
-
78
-
79
-
80
-
81
-
82
-
83
-
84
-
85
-
86
-
87
-
88
-
89
-
90
-
91
-
92
-
93
-
94
-
95
-
96
-
97
-
98
-
 99
99 -
 100
100 -
 101
101 -
 102
102 -
 103
103 -
 104
104 -
 105
105 -
 106
106 -
 107
107 -
 108
108 -
 109
109 -
 110
110 -
 111
111 -
 112
112 -
 113
113 -
 114
114 -
 115
115 -
 116
116 -
 117
117 -
 118
118 -
 119
119 -
120
-
121
-
122
-
123
-
124
-
125
-
126
-
127
-
128
-
129
-
130
 |
 |

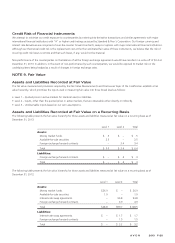
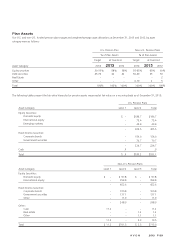
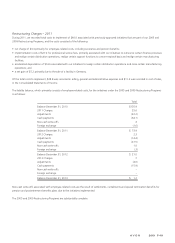
Plan Assets
Our U.S. and non-U.S. funded pension plans target and weighted-average asset allocations at December 31, 2013 and 2012, by asset
category were as follows:
U.S. Pension Plan Non-U.S. Pension Plans
% of Plan Assets % of Plan Assets
Target at Year End Target at Year End
Asset Category 2014 2013 2012 2014 2013 2012
Equity securities 30-35% 58% 58% 55-65% 63% 60%
Debt securities 65-70 42 42 30-40 35 33
Real Estate – – – – – 2
Other – – – 0-10 2 5
Total 100% 100% 100% 100% 100% 100%
The following tables present the fair value hierarchy for pension assets measured at fair value on a recurring basis as of December 31, 2013:
U.S. Pension Plans
Asset Category Level 1 Level 2 Total
Equity Securities:
Domestic equity $ – $186.7 $186.7
International equity – 75.4 75.4
Emerging markets – 43.4 43.4
– 305.5 305.5
Fixed Income Securities:
Corporate bonds – 154.0 154.0
Government securities – 70.7 70.7
– 224.7 224.7
Cash .9 – .9
Total $ .9 $530.2 $531.1
Non-U.S. Pension Plans
Asset Category Level 1 Level 2 Level 3 Total
Equity Securities:
Domestic equity $ – $ 97.8 $ – $ 97.8
International equity – 354.8 – 354.8
– 452.6 – 452.6
Fixed Income Securities:
Corporate bonds – 100.8 – 100.8
Government securities – 137.1 – 137.1
Other – 11.0 – 11.0
– 248.9 – 248.9
Other:
Cash 11.2 – – 11.2
Real estate – – 1.2 1.2
Other – – 1.1 1.1
11.2 – 2.3 13.5
Total $ 11.2 $701.5 $ 2.3 $715.0
A V O N 2013 F-39