Avon 2013 Annual Report Download - page 28
Download and view the complete annual report
Please find page 28 of the 2013 Avon annual report below. You can navigate through the pages in the report by either clicking on the pages listed below, or by using the keyword search tool below to find specific information within the annual report.-
 1
1 -
2
-
3
-
4
-
5
-
6
-
7
-
8
-
9
-
10
-
11
-
12
-
13
-
14
-
15
-
16
-
17
-
 18
18 -
 19
19 -
 20
20 -
 21
21 -
 22
22 -
 23
23 -
 24
24 -
 25
25 -
 26
26 -
 27
27 -
 28
28 -
 29
29 -
 30
30 -
 31
31 -
 32
32 -
 33
33 -
 34
34 -
 35
35 -
 36
36 -
 37
37 -
 38
38 -
39
-
40
-
41
-
42
-
43
-
44
-
45
-
46
-
47
-
48
-
49
-
50
-
51
-
52
-
53
-
54
-
55
-
56
-
57
-
58
-
59
-
60
-
61
-
62
-
63
-
64
-
65
-
66
-
67
-
68
-
69
-
70
-
71
-
72
-
73
-
74
-
75
-
76
-
77
-
78
-
79
-
80
-
81
-
82
-
83
-
84
-
85
-
86
-
87
-
88
-
89
-
90
-
91
-
92
-
93
-
94
-
95
-
96
-
97
-
98
-
99
-
100
-
101
-
102
-
103
-
104
-
105
-
106
-
107
-
108
-
109
-
110
-
111
-
112
-
113
-
114
-
115
-
116
-
117
-
118
-
119
-
120
-
121
-
122
-
123
-
124
-
125
-
126
-
127
-
128
-
129
-
130
 |
 |

PART II
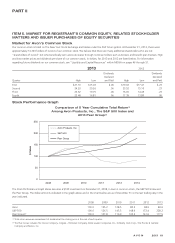
The Stock Performance Graph above shall not be deemed to be “soliciting material” or to be “filed” with the United States Securities and
Exchange Commission or subject to the liabilities of Section 18 under the Securities Exchange Act of 1934 as amended (the “Exchange
Act”). In addition, it shall not be deemed incorporated by reference by any statement that incorporates this annual report on Form 10-K by
reference into any filing under the Securities Act of 1933 (the “Securities Act”) or the Exchange Act, except to the extent that we specifically
incorporate this information by reference.
Issuer Purchases of Equity Securities
The following table provides information about our purchases of our common stock during the quarterly period ended December 31, 2013:
Total Number
of Shares
Purchased
Average Price
Paid per Share
Total Number of Shares
Purchased as Part of
Publicly Announced
Programs
Approximate Dollar
Value of Shares that
May Yet Be Purchased
Under the Program
10/1/13 – 10/31/13 8,064(1) $21.04 * *
11/1/13 – 11/30/13 2,095(2) 20.08 * *
12/1/13 – 12/31/13 34,119(1) 17.34 * *
Total 44,278 $18.14 * *
* These amounts are not applicable as the Company does not have a share repurchase program in effect.
(1) These shares were repurchased by the Company in connection with employee elections to use shares to pay withholding taxes upon the vesting of their
restricted stock units.
(2) Includes 1,219 shares purchased in private transactions with a broker in connection with stock based obligations under our Deferred Compensation Plan and
876 shares that were repurchased by the Company in connection with employee elections to use shares to pay withholding taxes upon the vesting of their
restricted stock units.
ITEM 6. SELECTED FINANCIAL DATA
(U.S. dollars in millions, except per share data)
We derived the following selected financial data from our audited Consolidated Financial Statements. The following data should be read in
conjunction with our MD&A and our Consolidated Financial Statements and related Notes contained in our 2013 Annual Report.
2013 2012 2011 2010 2009
Income Statement Data
Total revenue $9,955.0 $10,561.4 $11,099.5 $10,754.2 $10,205.2
Operating profit(1) 427.2 525.0 1,092.0 1,039.0 1,005.6
(Loss) income from continuing operations, net of tax(1) (1.0) 93.3 675.6 566.0 619.2
Diluted (loss) earnings per share from continuing operations $ (.01) $ .20 $ 1.54 $ 1.29 $ 1.43
Cash dividends per share $ .24 $ .75 $ .92 $ .88 $ .84
Balance Sheet Data
Total assets $6,492.3 $ 7,382.5 $ 7,735.0 $ 7,873.7 $ 6,823.4
Debt maturing within one year 188.0 572.0 849.3 727.6 137.8
Long-term debt 2,532.7 2,623.8 2,459.1 2,408.6 2,307.2
Total debt 2,720.7 3,195.8 3,308.4 3,136.2 2,445.0
Total shareholders’ equity 1,127.5 1,233.3 1,585.2 1,672.6 1,312.6
(1) A number of items, shown below, impact the comparability of our operating profit and (loss) income from continuing operations, net of tax. See Note 15,
Restructuring Initiatives on pages F-45 through F-49 of our 2013 Annual Report, “Results Of Continuing Operations – Consolidated” within MD&A on
pages 31 through 36, “Segment Review – Latin America” within MD&A on pages 38 through 41, Note 16, Contingencies on pages F-50 through F-52 of our
2013 Annual Report, Note 17, Goodwill and Intangibles on pages F-52 through F-53 of our 2013 Annual Report, Note 1, Description of the Business and
Summary of Significant Accounting Policies on pages F-8 through F-14 of our 2013 Annual Report, Note 5, Debt and Other Financing on pages F-17 through
F-21 of our 2013 Annual Report and Note 7, Income Taxes on pages F-22 through F-25 of our 2013 Annual Report for more information on these items.