Avon 2013 Annual Report Download - page 56
Download and view the complete annual report
Please find page 56 of the 2013 Avon annual report below. You can navigate through the pages in the report by either clicking on the pages listed below, or by using the keyword search tool below to find specific information within the annual report.-
 1
1 -
2
-
3
-
4
-
5
-
6
-
7
-
8
-
9
-
10
-
11
-
12
-
13
-
14
-
15
-
16
-
17
-
18
-
19
-
20
-
21
-
22
-
23
-
24
-
25
-
26
-
27
-
28
-
29
-
30
-
31
-
32
-
33
-
34
-
35
-
36
-
37
-
38
-
39
-
40
-
41
-
42
-
43
-
44
-
45
-
 46
46 -
 47
47 -
 48
48 -
 49
49 -
 50
50 -
 51
51 -
 52
52 -
 53
53 -
 54
54 -
 55
55 -
 56
56 -
 57
57 -
 58
58 -
 59
59 -
 60
60 -
 61
61 -
 62
62 -
 63
63 -
 64
64 -
 65
65 -
 66
66 -
67
-
68
-
69
-
70
-
71
-
72
-
73
-
74
-
75
-
76
-
77
-
78
-
79
-
80
-
81
-
82
-
83
-
84
-
85
-
86
-
87
-
88
-
89
-
90
-
91
-
92
-
93
-
94
-
95
-
96
-
97
-
98
-
99
-
100
-
101
-
102
-
103
-
104
-
105
-
106
-
107
-
108
-
109
-
110
-
111
-
112
-
113
-
114
-
115
-
116
-
117
-
118
-
119
-
120
-
121
-
122
-
123
-
124
-
125
-
126
-
127
-
128
-
129
-
130
 |
 |
PART II
Net Cash from Continuing Investing Activities
Net cash used by continuing investing activities during 2013 was $40.0 lower than during 2012, primarily due to lower capital expenditures,
as well as higher proceeds received for the disposal of assets, primarily in the U.S, due to the sale of facilities associated with our
restructuring initiatives. Net cash used by continuing investing activities during 2012 was $54.0 lower than during 2011 primarily due to
lower capital expenditures.
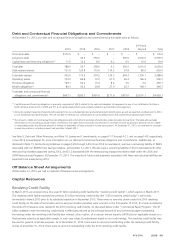
Capital expenditures during 2013 were $197.3 compared with $228.5 during 2012, driven by lower spend associated with SMT primarily
due to the launch of the pilot in Canada, and to a lesser extent, the decision to halt the further roll-out of SMT beyond Canada in the fourth
quarter of 2013. Capital expenditures during 2012 were $228.5 compared with $276.4 during 2011, as 2011 included higher investment
associated with new distribution facilities in Latin America. Capital expenditures in 2014 are currently expected to be approximately $200 to
$230 and are expected to be funded by cash from operations.
Net Cash from Continuing Financing Activities
Net cash used by continuing financing activities was $467.9 during 2013 compared to $401.3 during 2012 primarily due to the prepayment
of $535.0 principal amount of the Private Notes (as defined below), the prepayment of $500.0 principal amount of the 2014 Notes (as
defined below), the repayment of $497.5 of the outstanding principal amount of the term loan agreement, the scheduled repayment of
$250.0 principal amount of the 4.80% Notes (as defined below), the scheduled repayment of $125.0 principal amount of the 4.625%
Notes (as defined below) and lower debt issuances in various markets. This was partially offset by proceeds of $1.5 billion related to issuance
of the Notes (as defined below) in the first quarter of 2013 as compared to proceeds of $550.0 related to borrowings under our term loan
agreement in 2012, as well as lower repayments of commercial paper and lower dividend payments in 2013. See Note 5, Debt and Other
Financing on pages F-17 through F-21 of our 2013 Annual Report for more information. In addition, during 2013 we had proceeds of $88.1
related to the termination of interest-rate swap agreements designated as fair value hedges, compared to proceeds of $43.6 during 2012.
See Note 8, Financial Instruments and Risk Management on pages F-26 through F-29 of our 2013 Annual Report for more information.
Net cash used by continuing financing activities during 2012 was $401.3 compared with $284.5 in 2011, primarily due to lower issuances of
commercial paper, and was partially offset by the proceeds of $550.0 related to the term loan agreement entered into during 2012, the
scheduled repayment of $500.0 principal amount of notes in 2011, lower dividend payments in 2012 and proceeds of $43.6 during 2012
related to the termination of two of our interest-rate swap agreements designated as fair value hedges. See Note 8, Financial Instruments
and Risk Management on pages F-26 through F-29 of our 2013 Annual Report for more information.
We purchased approximately .5 million shares of our common stock for $9.4 during 2013, as compared to .5 million shares of our common
stock for $8.8 during 2012 and .4 million shares for $7.7 during 2011, through repurchases by the Company in connection with employee
elections to use shares to pay withholding taxes upon the vesting of their restricted stock units and private transactions with a broker in
connection with stock based obligations under our Deferred Compensation Plan.
We have maintained a quarterly dividend of $.06 per share for 2013. During the full year 2011 and the first nine months of 2012 our
quarterly dividend payments were $.23 per share, whereas in the fourth quarter of 2012 our quarterly dividend payment was $.06 per share.
We have maintained the dividend of $.06 per share for the first quarter of 2014.