Avon 2013 Annual Report Download - page 48
Download and view the complete annual report
Please find page 48 of the 2013 Avon annual report below. You can navigate through the pages in the report by either clicking on the pages listed below, or by using the keyword search tool below to find specific information within the annual report.-
 1
1 -
2
-
3
-
4
-
5
-
6
-
7
-
8
-
9
-
10
-
11
-
12
-
13
-
14
-
15
-
16
-
17
-
18
-
19
-
20
-
21
-
22
-
23
-
24
-
25
-
26
-
27
-
28
-
29
-
30
-
31
-
32
-
33
-
34
-
35
-
36
-
37
-
 38
38 -
 39
39 -
 40
40 -
 41
41 -
 42
42 -
 43
43 -
 44
44 -
 45
45 -
 46
46 -
 47
47 -
 48
48 -
 49
49 -
 50
50 -
 51
51 -
 52
52 -
 53
53 -
 54
54 -
 55
55 -
 56
56 -
 57
57 -
 58
58 -
59
-
60
-
61
-
62
-
63
-
64
-
65
-
66
-
67
-
68
-
69
-
70
-
71
-
72
-
73
-
74
-
75
-
76
-
77
-
78
-
79
-
80
-
81
-
82
-
83
-
84
-
85
-
86
-
87
-
88
-
89
-
90
-
91
-
92
-
93
-
94
-
95
-
96
-
97
-
98
-
99
-
100
-
101
-
102
-
103
-
104
-
105
-
106
-
107
-
108
-
109
-
110
-
111
-
112
-
113
-
114
-
115
-
116
-
117
-
118
-
119
-
120
-
121
-
122
-
123
-
124
-
125
-
126
-
127
-
128
-
129
-
130
 |
 |

PART II
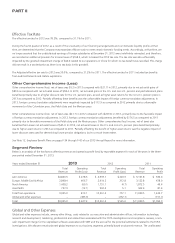
At December 31, 2013, Avon Venezuela had pending requests submitted with an agency of the Venezuelan government for approximately
$54 for remittance of dividends and royalties to its parent company in the U.S. These outstanding requests had been periodically submitted
between 2005 and 2012. We are currently unable to predict the likelihood of government approvals of these requests, or if approved, the
estimated time for remittance.
In late 2011, the Argentine government introduced restrictive currency exchange controls. Unless foreign exchange is made more readily
available at the official exchange rate, Avon Argentina’s operations may be negatively impacted. At December 31, 2013, we had a net asset
position of $83 associated with our operations in Argentina. During 2013, Avon Argentina represented approximately 4% of Avon’s
consolidated revenue, 10% of Avon’s consolidated operating profit and 6% of Avon’s consolidated Adjusted operating profit.
To illustrate our sensitivity to potential future changes in the exchange rate in Argentina, if the exchange rate was devalued by
approximately 50% from the average exchange rate of Argentina’s 2013 results, and using the 2013 results, Avon’s annualized consolidated
revenues would likely be negatively impacted by approximately 2% and annualized consolidated operating profit would likely be negatively
impacted by approximately 3% prospectively. This sensitivity analysis was performed assuming no operational improvements occurred to
offset the negative impact of a devaluation.
As of December 31, 2013, we did not account for Argentina as a highly inflationary economy. As a result, any potential devaluation would
not negatively impact earnings with respect to Argentina’s monetary and non-monetary assets.
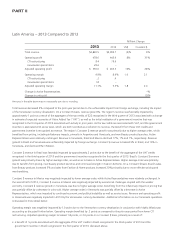
Latin America – 2012 Compared to 2011
%/Point Change
2012 2011 US$ Constant $
Total revenue $4,993.7 $5,161.8 (3)% 5%
Operating profit 443.9 634.0 (30)% (20)%
CTI restructuring 19.6 3.1
Adjusted operating profit $ 463.5 $ 637.1 (27)% (17)%
Operating margin 8.9% 12.3% (3.4) (3.0)
CTI restructuring .4 .1
Adjusted operating margin 9.3% 12.3% (3.0) (2.6)
Change in Active Representatives 3%
Change in units sold 2%
Amounts in the table above may not necessarily sum due to rounding.
Total revenue declined 3% due to unfavorable foreign exchange. On a Constant $ basis, revenue grew 5% due to an increase in Active
Representatives, as well as higher average order. Average order benefited from pricing, including inflationary impacts. Revenue in Brazil
declined 12%, negatively impacted by foreign exchange, while revenue in Mexico grew 1%. Constant $ revenue benefited from growth of
3% in Brazil and 8% in Mexico. In Venezuela, revenue and Constant $ revenue grew 13%. Constant $ revenue growth in Brazil was driven
by an increase in Active Representatives. Revenue growth in Brazil was negatively impacted by decreased demand, which was partially due
to increased competition, as well as uncompetitive pricing in Fashion and Home during the first half of 2012. Brazil’s sales of Beauty
products declined 11% and sales of Fashion & Home products declined 15%, both negatively impacted by foreign exchange. On a Constant
$ basis, Brazil’s sales of Beauty products increased 4% and sales of Fashion & Home products were flat.
Constant $ revenue growth in Mexico was driven by an increase in Active Representatives, as well as higher average order. Revenue growth
in Venezuela was primarily due to higher average order, benefiting from the inflationary impact on pricing; however, Venezuela revenue
growth was restrained during the latter half of 2012 by slowing economic activity and the impact of lower inflation on pricing.