Avon 2013 Annual Report Download - page 101
Download and view the complete annual report
Please find page 101 of the 2013 Avon annual report below. You can navigate through the pages in the report by either clicking on the pages listed below, or by using the keyword search tool below to find specific information within the annual report.-
 1
1 -
2
-
3
-
4
-
5
-
6
-
7
-
8
-
9
-
10
-
11
-
12
-
13
-
14
-
15
-
16
-
17
-
18
-
19
-
20
-
21
-
22
-
23
-
24
-
25
-
26
-
27
-
28
-
29
-
30
-
31
-
32
-
33
-
34
-
35
-
36
-
37
-
38
-
39
-
40
-
41
-
42
-
43
-
44
-
45
-
46
-
47
-
48
-
49
-
50
-
51
-
52
-
53
-
54
-
55
-
56
-
57
-
58
-
59
-
60
-
61
-
62
-
63
-
64
-
65
-
66
-
67
-
68
-
69
-
70
-
71
-
72
-
73
-
74
-
75
-
76
-
77
-
78
-
79
-
80
-
81
-
82
-
83
-
84
-
85
-
86
-
87
-
88
-
89
-
90
-
 91
91 -
 92
92 -
 93
93 -
 94
94 -
 95
95 -
 96
96 -
 97
97 -
 98
98 -
 99
99 -
 100
100 -
 101
101 -
 102
102 -
 103
103 -
 104
104 -
 105
105 -
 106
106 -
 107
107 -
 108
108 -
 109
109 -
 110
110 -
 111
111 -
112
-
113
-
114
-
115
-
116
-
117
-
118
-
119
-
120
-
121
-
122
-
123
-
124
-
125
-
126
-
127
-
128
-
129
-
130
 |
 |

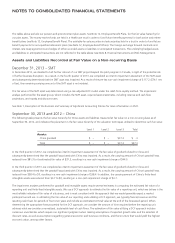
Key assumptions used in measuring the fair value of China included projections of revenue and the resulting cash flows, as well as the
discount rate (based on the weighted-average cost of capital). To estimate the fair value of China, we forecasted revenue and the resulting
cash flows over ten years using a DCF model which included a terminal value at the end of the projection period. We believed that a ten-
year period was a reasonable amount of time in order to return China’s cash flows to normalized, sustainable levels.
See Note 17, Goodwill and Intangible Assets for more information on China.
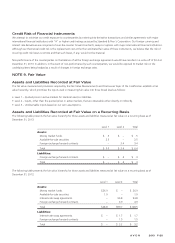
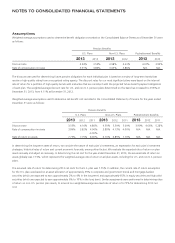
Fair Value of Financial Instruments
Our financial instruments include cash and cash equivalents, available-for-sale securities, short-term investments, money market funds,
accounts receivable, loans receivable, debt maturing within one year, accounts payable, long-term debt, foreign exchange forwards
contracts, and interest-rate swap agreements. The carrying value for cash and cash equivalents, accounts receivable, accounts payable, and
short-term investments approximate fair value because of the short-term nature of these instruments. The net asset (liability) amounts
recorded in the balance sheet (carrying amount) and the estimated fair values of our remaining financial instruments at December 31
consisted of the following:
2013 2012
Carrying
Amount
Fair
Value
Carrying
Amount
Fair
Value
Available-for-sale securities $ 2.5 $ 2.5 $ 1.9 $ 1.9
Money market funds .5 .5 26.9 26.9
Debt maturing within one year(1) (188.0) (188.0) (572.0) (572.2)
Long-term debt(1) (2,532.7) (2,511.6) (2,623.8) (2,547.7)
Foreign exchange forward contracts 3.1 3.1 3.4 3.4
Interest-rate swap agreements – – 93.1 93.1
(1) The carrying value of debt maturing within one year and long-term debt includes any related discount or premium, unamortized deferred gains on terminated
interest-rate swap agreements, and unrealized losses from interest-rate swap agreements, as applicable.
The methods and assumptions used to estimate fair value are as follows:
Available-for-sale securities and money market funds – The fair values of these investments were the quoted market prices for issues listed
on securities exchanges.
Debt maturing within one year and long-term debt – The fair values of our debt and other financing were determined using Level 2 inputs
based on indicative market prices.
Foreign exchange forward contracts – The fair values of forward contracts were estimated based on quoted forward foreign exchange prices
at the reporting date.
Interest-rate swap agreements – The fair values of interest-rate swap agreements were estimated based on LIBOR yield curves at the
reporting date.
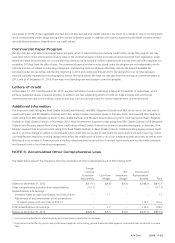
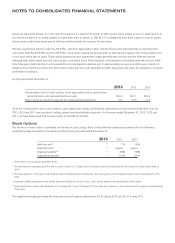
NOTE 10. Share-Based Compensation Plans
The Avon Products, Inc. 2010 Stock Incentive Plan (the “2010 Plan”) and the Avon Products, Inc. 2013 Stock Incentive Plan (the “2013
Plan”), which are shareholder approved plans, provide for several types of share-based incentive compensation awards including stock
options, stock appreciation rights, restricted stock, restricted stock units and performance restricted stock units. Following shareholder
approval of the 2013 Plan in May 2013, there were no further awards made under the 2010 Plan. Under the 2010 Plan, the maximum
number of shares that may be awarded was 32,000,000 shares, where the maximum number of shares was reduced as follows: (i) in the
case of the grant of an award of an option or Stock Appreciation Right (“SAR”), by each share of stock subject to such an award and (ii) in
the case of the grant of an award payable in stock other than an option or SAR by 2.33 multiplied by each share of stock subject to such
award. Under the 2013 Plan, the maximum number of shares that may be awarded is 42,000,000 shares, where the maximum number of
A V O N 2013 F-31