Avon 2013 Annual Report Download - page 93
Download and view the complete annual report
Please find page 93 of the 2013 Avon annual report below. You can navigate through the pages in the report by either clicking on the pages listed below, or by using the keyword search tool below to find specific information within the annual report.-
 1
1 -
2
-
3
-
4
-
5
-
6
-
7
-
8
-
9
-
10
-
11
-
12
-
13
-
14
-
15
-
16
-
17
-
18
-
19
-
20
-
21
-
22
-
23
-
24
-
25
-
26
-
27
-
28
-
29
-
30
-
31
-
32
-
33
-
34
-
35
-
36
-
37
-
38
-
39
-
40
-
41
-
42
-
43
-
44
-
45
-
46
-
47
-
48
-
49
-
50
-
51
-
52
-
53
-
54
-
55
-
56
-
57
-
58
-
59
-
60
-
61
-
62
-
63
-
64
-
65
-
66
-
67
-
68
-
69
-
70
-
71
-
72
-
73
-
74
-
75
-
76
-
77
-
78
-
79
-
80
-
81
-
82
-
 83
83 -
 84
84 -
 85
85 -
 86
86 -
 87
87 -
 88
88 -
 89
89 -
 90
90 -
 91
91 -
 92
92 -
 93
93 -
 94
94 -
 95
95 -
 96
96 -
 97
97 -
 98
98 -
 99
99 -
 100
100 -
 101
101 -
 102
102 -
 103
103 -
104
-
105
-
106
-
107
-
108
-
109
-
110
-
111
-
112
-
113
-
114
-
115
-
116
-
117
-
118
-
119
-
120
-
121
-
122
-
123
-
124
-
125
-
126
-
127
-
128
-
129
-
130
 |
 |

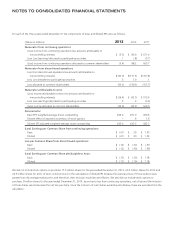
Deferred tax assets (liabilities) resulting from temporary differences in the recognition of income and expense for tax and financial reporting
purposes at December 31 consisted of the following:
2013 2012
Deferred tax assets:
Accrued expenses and reserves $ 274.2 $ 279.3
Pension and postretirement benefits 132.0 195.6
Asset revaluations 37.4 39.4
Capitalized expenses 199.4 131.8
Intangible assets – 142.3
Share-based compensation 63.7 62.2
Restructuring initiatives 23.9 26.4
Postemployment benefits 8.1 14.0
Tax loss carryforwards 756.1 648.0
Foreign tax credit carryforwards 585.4 356.0
Minimum tax and business credit carryforwards 53.2 47.5
All other 52.6 65.9
Valuation allowance (783.4) (627.4)
Total deferred tax assets 1,402.6 1,381.0
Deferred tax liabilities:
Depreciation and amortization (55.9) (44.3)
Unremitted foreign earnings (142.8) (224.8)
Prepaid expenses (16.6) (10.0)
Capitalized interest (9.4) (10.2)
All other (33.7) (24.6)
Total deferred tax liabilities (258.4) (313.9)
Net deferred tax assets $1,144.2 $1,067.1
Deferred tax assets (liabilities) at December 31 were classified as follows:
2013 2012
Deferred tax assets:
Prepaid expenses and other $ 233.6 $ 273.5
Other assets 944.7 826.9
Total deferred tax assets 1,178.3 1,100.4
Deferred tax liabilities:
Income taxes (1.1) (6.1)
Long-term income taxes (33.0) (27.2)
Total deferred tax liabilities (34.1) (33.3)
Net deferred tax assets $1,144.2 $1,067.1
The valuation allowance primarily represents amounts for foreign tax loss carryforwards. The basis used for recognition of deferred tax assets
included the profitability of the operations, related deferred tax liabilities and the likelihood of utilizing tax credit carryforwards during the
carryover periods. The net increase in the valuation allowance of $156.0 during 2013 was mainly due to several of our foreign entities
continuing to incur losses during 2013, thereby increasing the tax loss carryforwards for which a valuation allowance was provided. In
addition, the net increase in the valuation allowance was partially attributable to Venezuela, due to the impact of higher than expected
inflation on our taxable income which negatively impacted the likelihood we would realize existing deferred tax assets. Given the short life
of the net operating loss carryforward periods for Venezuela, we determined that it was more likely than not that we would not use these
carryforward losses before they expire.
A V O N 2013 F-23