Avon 2013 Annual Report Download - page 34
Download and view the complete annual report
Please find page 34 of the 2013 Avon annual report below. You can navigate through the pages in the report by either clicking on the pages listed below, or by using the keyword search tool below to find specific information within the annual report.-
 1
1 -
2
-
3
-
4
-
5
-
6
-
7
-
8
-
9
-
10
-
11
-
12
-
13
-
14
-
15
-
16
-
17
-
18
-
19
-
20
-
21
-
22
-
23
-
 24
24 -
 25
25 -
 26
26 -
 27
27 -
 28
28 -
 29
29 -
 30
30 -
 31
31 -
 32
32 -
 33
33 -
 34
34 -
 35
35 -
 36
36 -
 37
37 -
 38
38 -
 39
39 -
 40
40 -
 41
41 -
 42
42 -
 43
43 -
 44
44 -
45
-
46
-
47
-
48
-
49
-
50
-
51
-
52
-
53
-
54
-
55
-
56
-
57
-
58
-
59
-
60
-
61
-
62
-
63
-
64
-
65
-
66
-
67
-
68
-
69
-
70
-
71
-
72
-
73
-
74
-
75
-
76
-
77
-
78
-
79
-
80
-
81
-
82
-
83
-
84
-
85
-
86
-
87
-
88
-
89
-
90
-
91
-
92
-
93
-
94
-
95
-
96
-
97
-
98
-
99
-
100
-
101
-
102
-
103
-
104
-
105
-
106
-
107
-
108
-
109
-
110
-
111
-
112
-
113
-
114
-
115
-
116
-
117
-
118
-
119
-
120
-
121
-
122
-
123
-
124
-
125
-
126
-
127
-
128
-
129
-
130
 |
 |

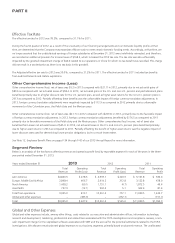
PART II
(which are expected to earn approximately 2% to 4% in the long term) and approximately 65% in equity securities and high yield securities
(which are expected to earn approximately 6% to 10% in the long term). Historical rates of return on the assets of the U.S. plan were
approximately 9% for the most recent 10-year period and approximately 8% for the 20-year period. In the U.S. plan, our asset allocation
policy has historically favored U.S. equity securities, which have returned approximately 8% over the 10-year period and approximately 8%
over the 20-year period. The rate of return on the plan assets in the U.S. was approximately 13% in 2013 and approximately 15% in 2012.
Beginning in 2014, our investment strategy for the U.S. pension plan is designed to match the movements in the pension liability through an
increased allocation towards debt securities. In addition, we will also utilize derivative instruments to achieve the desired market exposures or
to hedge certain risks.
Regulations under the Pension Protection Act of 2006, which are finalized but not yet effective, will require that hybrid plans limit the
maximum interest crediting rate to one among several choices of crediting rates which are considered “market rates of return.” The rate
chosen will affect total pension obligations. The discount rate used for determining future pension obligations for each individual plan is
based on a review of long-term bonds that receive a high-quality rating from a recognized rating agency. The discount rates for our more
significant plans, including our U.S. plan, were based on the internal rates of return for a portfolio of high quality bonds with maturities that
are consistent with the projected future benefit payment obligations of each plan. The weighted-average discount rate for U.S. and non-U.S.
pension plans determined on this basis was 4.56% at December 31, 2013, and 4.11% at December 31, 2012. For the determination of the
expected rate of return on assets and the discount rate, we take into consideration external actuarial advice.
Our funding requirements may be impacted by regulations or interpretations thereof. Our calculations of pension and postretirement costs
are dependent on the use of assumptions, including discount rates, hybrid plan maximum interest crediting rates and expected return on
plan assets discussed above, rate of compensation increase of plan participants, interest cost, health care cost trend rates, benefits earned,
mortality rates, the number of associate retirements, the number of associates electing to take lump-sum payments and other factors. Actual
results that differ from assumptions are accumulated and amortized to expense over future periods and, therefore, generally affect
recognized expense in future periods. At December 31, 2013, we had pretax actuarial losses and prior service credits totaling $347 for the
U.S. pension and postretirement plans and $285 for the non-U.S. pension and postretirement plans that have not yet been charged to
expense. These actuarial losses have been charged to accumulated other comprehensive loss (“AOCI”) within shareholders’ equity. While we
believe that the assumptions used are reasonable, differences in actual experience or changes in assumptions may materially affect our
pension and postretirement obligations and future expense. For 2014, our assumption for the expected rate of return on assets is 7.50% for
our U.S. pension plan and 6.40% for our non-U.S. pension plans. Our assumptions are reviewed and determined on an annual basis.
A 50 basis point change (in either direction) in the expected rate of return on plan assets, the discount rate or the rate of compensation
increases, would have had approximately the following effect on 2013 pension expense and the pension benefit obligation at December 31,
2013:
Increase/(Decrease) in
Pension Expense
Increase/(Decrease) in
Pension Obligation
50 Basis Point 50 Basis Point
Increase Decrease Increase Decrease
Rate of return on assets $(5.5) $ 5.5 N/A N/A
Discount rate (9.0) 9.1 $(100.9) $108.4
Rate of compensation increase 1.9 (1.8) 7.2 (7.0)
Restructuring Reserves
We record the estimated expense for our restructuring initiatives when such costs are deemed probable and estimable, when approved by
the appropriate corporate authority and by accumulating detailed estimates of costs for such plans. These expenses include the estimated
costs of employee severance and related benefits, impairment or accelerated depreciation of property, plant and equipment and capitalized
software, and any other qualifying exit costs. These estimated costs are grouped by specific projects within the overall plan and are then
monitored on a quarterly basis by finance personnel. Such costs represent our best estimate, but require assumptions about the programs
that may change over time, including attrition rates. Estimates are evaluated periodically to determine whether an adjustment is required.