Avon 2013 Annual Report Download - page 54
Download and view the complete annual report
Please find page 54 of the 2013 Avon annual report below. You can navigate through the pages in the report by either clicking on the pages listed below, or by using the keyword search tool below to find specific information within the annual report.-
 1
1 -
2
-
3
-
4
-
5
-
6
-
7
-
8
-
9
-
10
-
11
-
12
-
13
-
14
-
15
-
16
-
17
-
18
-
19
-
20
-
21
-
22
-
23
-
24
-
25
-
26
-
27
-
28
-
29
-
30
-
31
-
32
-
33
-
34
-
35
-
36
-
37
-
38
-
39
-
40
-
41
-
42
-
43
-
 44
44 -
 45
45 -
 46
46 -
 47
47 -
 48
48 -
 49
49 -
 50
50 -
 51
51 -
 52
52 -
 53
53 -
 54
54 -
 55
55 -
 56
56 -
 57
57 -
 58
58 -
 59
59 -
 60
60 -
 61
61 -
 62
62 -
 63
63 -
 64
64 -
65
-
66
-
67
-
68
-
69
-
70
-
71
-
72
-
73
-
74
-
75
-
76
-
77
-
78
-
79
-
80
-
81
-
82
-
83
-
84
-
85
-
86
-
87
-
88
-
89
-
90
-
91
-
92
-
93
-
94
-
95
-
96
-
97
-
98
-
99
-
100
-
101
-
102
-
103
-
104
-
105
-
106
-
107
-
108
-
109
-
110
-
111
-
112
-
113
-
114
-
115
-
116
-
117
-
118
-
119
-
120
-
121
-
122
-
123
-
124
-
125
-
126
-
127
-
128
-
129
-
130
 |
 |

PART II
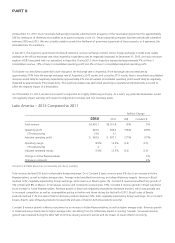
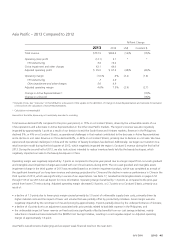
Asia Pacific – 2012 Compared to 2011
%/Point Change
2012 2011 US$ Constant $
Total revenue $902.4 $942.4 (4)% (5)%
Operating profit 5.1 81.4 (94)% (95)%
CTI restructuring 18.2 (.3)
China impairment and other charges 44.0 –
Adjusted operating profit $ 67.3 $ 81.1 (17)% (19)%
Operating margin .6% 8.6% (8.0) (8.2)
CTI restructuring 2.0 –
China impairment and other charges 4.9 –
Adjusted operating margin 7.5% 8.6% (1.1) (1.3)
Change in Active Representatives(1) (1)%
Change in units sold (7)%
(1) Excludes China. See “Overview” in this MD&A for a discussion of the update to the definition of Change in Active Representatives and rationale for exclusion
of China from the calculation of Active Representatives.
Amounts in the table above may not necessarily sum due to rounding.
Total revenue declined 4%, or 5% on a Constant $ basis, primarily due to the unfavorable results of our China operations and a decrease in
Active Representatives in certain other Asia Pacific markets. Revenue in China declined 22%, or 24% in Constant $, due to declines in unit
sales resulting from continuing weak performance in that market. Revenue in the Philippines grew 7%, or 4% in Constant $, driven by
growth in Active Representatives.
Operating margin was negatively impacted by 4.9 points by a non-cash goodwill impairment charge associated with our China business. See
Note 17, Goodwill and Intangible Assets on pages F-52 through F-53 of our 2013 Annual Report for more information. Operating margin
was also negatively impacted by 2.0 points as compared to the prior-year period from higher CTI restructuring. Adjusted operating margin
declined 1.1 points, or 1.3 points on a Constant $ basis, primarily as a result of:
• a decline of 1.1 points due to lower gross margin caused primarily by .7 points from the unfavorable net impact of mix and higher pricing
primarily due to weakness in skincare;
• a decline of 1.2 points due to wage inflation outpacing revenue growth, partially offset by restructuring savings; and
• a benefit of .8 points from lower Representative and sales leader investment, primarily due to China as a result of our transition to a retail
compensation model in that market.
Liquidity and Capital Resources
Our principal sources of funds historically have been cash flows from operations, borrowings under lines of credit, public offerings of notes,
bank financings, issuance of commercial paper and a private placement. At December 31, 2013 we had cash and cash equivalents totaling
$1,108. We held cash balances associated with our Venezuela operations denominated in Bolívares amounting to approximately $135 when
translated at the official exchange rate at December 31, 2013. Currency restrictions enacted by the Venezuelan government have limited our
ability to repatriate dividends and royalties from our Venezuelan operations. For more information with respect to these currency restrictions
and the currency devaluation, see “Segment Review – Latin America” in this MD&A above, and for more information regarding risks with
respect to these currency restrictions, see “Risk Factors – We are subject to financial risks related to our international operations, including
exposure to foreign currency fluctuations” included in Item 1A on pages 7 through 17 of our 2013 Annual Report.
In March 2013, we entered into a revolving credit facility (as defined below under “Capital Resources – Revolving Credit Facility”) and issued
$1.5 billion aggregate principal amount of Notes (as defined below under “Capital Resources – Public Notes”), which we believe improved
our capital structure and extended the maturity profile of our long-term debt. The proceeds from the Notes were used to repay existing
debt.