Avon 2013 Annual Report Download - page 44
Download and view the complete annual report
Please find page 44 of the 2013 Avon annual report below. You can navigate through the pages in the report by either clicking on the pages listed below, or by using the keyword search tool below to find specific information within the annual report.-
 1
1 -
2
-
3
-
4
-
5
-
6
-
7
-
8
-
9
-
10
-
11
-
12
-
13
-
14
-
15
-
16
-
17
-
18
-
19
-
20
-
21
-
22
-
23
-
24
-
25
-
26
-
27
-
28
-
29
-
30
-
31
-
32
-
33
-
 34
34 -
 35
35 -
 36
36 -
 37
37 -
 38
38 -
 39
39 -
 40
40 -
 41
41 -
 42
42 -
 43
43 -
 44
44 -
 45
45 -
 46
46 -
 47
47 -
 48
48 -
 49
49 -
 50
50 -
 51
51 -
 52
52 -
 53
53 -
 54
54 -
55
-
56
-
57
-
58
-
59
-
60
-
61
-
62
-
63
-
64
-
65
-
66
-
67
-
68
-
69
-
70
-
71
-
72
-
73
-
74
-
75
-
76
-
77
-
78
-
79
-
80
-
81
-
82
-
83
-
84
-
85
-
86
-
87
-
88
-
89
-
90
-
91
-
92
-
93
-
94
-
95
-
96
-
97
-
98
-
99
-
100
-
101
-
102
-
103
-
104
-
105
-
106
-
107
-
108
-
109
-
110
-
111
-
112
-
113
-
114
-
115
-
116
-
117
-
118
-
119
-
120
-
121
-
122
-
123
-
124
-
125
-
126
-
127
-
128
-
129
-
130
 |
 |

PART II
Effective Tax Rate
The effective tax rate for 2012 was 78.2%, compared to 31.1% for 2011.
During the fourth quarter of 2012, as a result of the uncertainty of our financing arrangements and our domestic liquidity profile at that
time, we determined that the Company may repatriate offshore cash to meet certain domestic funding needs. Accordingly, at that time, we
no longer asserted that the undistributed earnings of foreign subsidiaries at December 31, 2012 were indefinitely reinvested, and therefore,
we recorded an additional provision for income taxes of $168.3, which increased the 2012 tax rate. The tax rate was also unfavorably
impacted by the goodwill impairment charge of $44.0 related to our operations in China for which no tax benefit was recorded. This charge
did not result in a tax deduction as there is no tax basis in this goodwill.
The Adjusted effective tax rate for 2012 was 35.0%, compared to 31.2% for 2011. The effective tax rate for 2011 included tax benefits
from audit settlements and statute expirations.
Other Comprehensive Income (Loss)
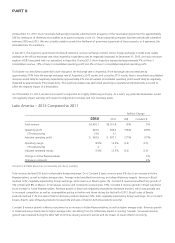
Other comprehensive income (loss), net of taxes was $5.2 in 2013 compared with ($21.7) in 2012, primarily due to net actuarial gains of
$80.6 as compared with net actuarial losses of $58.4. In 2013, net actuarial gains in the U.S. and non-U.S. pension and postretirement plans
benefited primarily due to a higher discount rate for the U.S. pension plan, as well as higher asset returns for the non-U.S. pension plans in
2013 as compared to 2012. Partially offsetting these benefits was the unfavorable impact of foreign currency translation adjustments. In
2013, foreign currency translation adjustments were negatively impacted by $112.9 as compared to 2012 primarily due to unfavorable
movements of the Colombian peso, the Polish zloty and the Mexican peso.
Other comprehensive income (loss), net of taxes was ($21.7) in 2012 compared with ($249.0) in 2011, primarily due to the favorable impact
of foreign currency translation adjustments. In 2012, foreign currency translation adjustments benefited by $176.5 as compared to 2011
primarily due to favorable movements of the Polish zloty and the Mexican peso. Other comprehensive (loss) income, net of taxes also
benefited from lower net actuarial losses of $45.0. In 2012, net actuarial losses in the U.S. and non-U.S. pension plans benefited primarily
due to higher asset returns in 2012 as compared to 2011. Partially offsetting the benefit of higher asset returns was the negative impact of
lower discount rates used for determining future pension obligations, but to a much lesser extent.
See Note 12, Employee Benefit Plans on pages F-34 through F-42 of our 2013 Annual Report for more information.
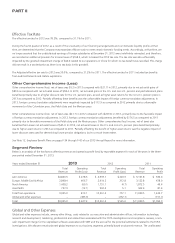
Segment Review
Below is an analysis of the key factors affecting revenue and operating profit (loss) by reportable segment for each of the years in the three-
year period ended December 31, 2013.
Years ended December 31 2013 2012 2011
Total
Revenue
Operating
Profit (Loss)
Total
Revenue
Operating
Profit (Loss)
Total
Revenue
Operating
Profit
Latin America $4,840.5 $ 478.6 $ 4,993.7 $ 443.9 $ 5,161.8 $ 634.0
Europe, Middle East & Africa 2,898.4 406.7 2,914.2 312.8 3,122.8 478.9
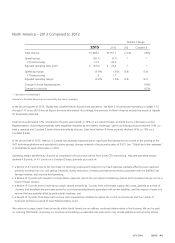
North America 1,458.2 (60.1) 1,751.1 (4.7) 1,872.5 49.4
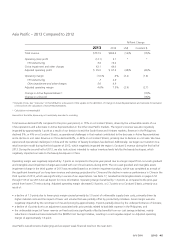
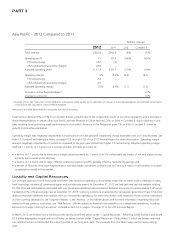
Asia Pacific 757.9 (12.1) 902.4 5.1 942.4 81.4
Total from operations 9,955.0 813.1 10,561.4 757.1 11,099.5 1,243.7
Global and other expenses – (385.9) – (232.1) – (151.7)
Total $9,955.0 $ 427.2 $10,561.4 $ 525.0 $11,099.5 $1,092.0
Global and Other Expenses
Global and other expenses include, among other things, costs related to our executive and administrative offices, information technology,
research and development, marketing, professional and related fees associated with the FCPA investigations and compliance reviews, a non-
cash impairment charge for the capitalized software associated with SMT and the accrual for the potential settlements related to the FCPA
investigations. We allocate certain planned global expenses to our business segments primarily based on planned revenue. The unallocated