Avon 2013 Annual Report Download - page 31
Download and view the complete annual report
Please find page 31 of the 2013 Avon annual report below. You can navigate through the pages in the report by either clicking on the pages listed below, or by using the keyword search tool below to find specific information within the annual report.-
 1
1 -
2
-
3
-
4
-
5
-
6
-
7
-
8
-
9
-
10
-
11
-
12
-
13
-
14
-
15
-
16
-
17
-
18
-
19
-
20
-
 21
21 -
 22
22 -
 23
23 -
 24
24 -
 25
25 -
 26
26 -
 27
27 -
 28
28 -
 29
29 -
 30
30 -
 31
31 -
 32
32 -
 33
33 -
 34
34 -
 35
35 -
 36
36 -
 37
37 -
 38
38 -
 39
39 -
 40
40 -
 41
41 -
42
-
43
-
44
-
45
-
46
-
47
-
48
-
49
-
50
-
51
-
52
-
53
-
54
-
55
-
56
-
57
-
58
-
59
-
60
-
61
-
62
-
63
-
64
-
65
-
66
-
67
-
68
-
69
-
70
-
71
-
72
-
73
-
74
-
75
-
76
-
77
-
78
-
79
-
80
-
81
-
82
-
83
-
84
-
85
-
86
-
87
-
88
-
89
-
90
-
91
-
92
-
93
-
94
-
95
-
96
-
97
-
98
-
99
-
100
-
101
-
102
-
103
-
104
-
105
-
106
-
107
-
108
-
109
-
110
-
111
-
112
-
113
-
114
-
115
-
116
-
117
-
118
-
119
-
120
-
121
-
122
-
123
-
124
-
125
-
126
-
127
-
128
-
129
-
130
 |
 |

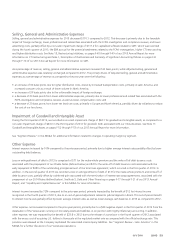
restructuring actions approved to-date associated with the $400M Cost Savings Initiative, we expect to realize annualized savings of
approximately $165 to $170 (both before taxes). See Note 15, Restructuring Initiatives on pages F-45 through F-49 of our 2013 Annual
Report for more information.
In December 2013, we decided to halt the further roll-out of our Service Model Transformation (“SMT”) project beyond the pilot market of
Canada, in light of the potential risk of further business disruption. As a result, a non-cash impairment charge for the capitalized software
associated with SMT of $117.2 was recorded. This impairment charge was recorded as a component of our global expenses, within selling,
general and administrative expenses in the Consolidated Statements of Income. See Note 1, Description of the Business and Summary of
Significant Accounting Policies on pages F-8 through F-14 of our 2013 Annual Report for more information regarding SMT.
As a result of the 32% devaluation of Venezuelan currency in February 2013, our 2013 revenue and operating margin was negatively
impacted. As a result of using the U.S. historic dollar cost basis of non-monetary assets, such as inventory, acquired prior to the devaluation,
2013 operating profit and net loss were negatively impacted by $50, due to the difference between the historical cost at the previous official
exchange rate of 4.30 and the official exchange rate of 6.30. In addition to the negative impact to operating margin, as a result of the
devaluation of Venezuelan currency, during the first quarter of 2013, we recorded a one-time, after-tax loss of $51 ($34 in other expense,
net and $17 in income taxes), primarily reflecting the write-down of monetary assets and liabilities and deferred tax benefits. See further
discussion of Venezuela in “Segment Review – Latin America” in this MD&A.
In July 2013, we completed the sale of our Silpada business (“Silpada”) for $85, plus an earn-out of up to $15 if Silpada achieves specific
earnings targets over two years. Silpada has been classified within discontinued operations for all periods presented. Silpada was previously
reported within our North America segment. In the second quarter of 2013, the Company recorded a pre-tax charge of $79 ($50 net of tax),
reflecting the expected loss on sale. See Note 3, Discontinued Operations, on pages F-15 through F-17 of our 2013 Annual Report for more
information.
New Accounting Standards
Information relating to new accounting standards is included in Note 2, New Accounting Standards, to our consolidated financial statements
contained in this 2013 Annual Report.
Performance Metrics
Within this MD&A, in addition to our key financial metrics of revenue, operating profit and operating margin, we utilize the performance
metrics defined below to assist in the evaluation of our business.
Performance Metrics Definition
Change in Active Representatives This metric is based on the number of unique orders in a campaign, totaled for all campaigns
in the related period, excluding China. This amount is divided by the number of billing days in
the related period, to exclude the impact of year-to-year changes in billing days (for example,
holiday schedules). To determine the growth in Active Representatives, this calculation is
compared to the same calculation in the corresponding period of the prior year.
Change in units sold This metric is based on the gross number of pieces of merchandise sold during a period, as
compared to the same number in the same period of the prior year. Units sold include
samples sold and products contingent upon the purchase of another product (for example,
gift with purchase or discount purchase with purchase), but exclude free samples.
Non-GAAP Financial Measures
To supplement our financial results presented in accordance with generally accepted accounting principles in the United States (“GAAP”),
we disclose operating results that have been adjusted to exclude the impact of changes due to the translation of foreign currencies into U.S.
dollars, including changes in: revenue, operating profit, Adjusted operating profit, operating margin and Adjusted operating margin. We
also refer to these adjusted financial measures as Constant $ items, which are Non-GAAP financial measures. We believe these measures
provide investors an additional perspective on trends. To exclude the impact of changes due to the translation of foreign currencies into U.S.
dollars, we calculate current-year results and prior-year results at a constant exchange rate. Currency impact is determined as the difference
between actual growth rates and constant- currency growth rates.
A V O N 2013 23