Avon 2013 Annual Report Download - page 42
Download and view the complete annual report
Please find page 42 of the 2013 Avon annual report below. You can navigate through the pages in the report by either clicking on the pages listed below, or by using the keyword search tool below to find specific information within the annual report.-
 1
1 -
2
-
3
-
4
-
5
-
6
-
7
-
8
-
9
-
10
-
11
-
12
-
13
-
14
-
15
-
16
-
17
-
18
-
19
-
20
-
21
-
22
-
23
-
24
-
25
-
26
-
27
-
28
-
29
-
30
-
31
-
 32
32 -
 33
33 -
 34
34 -
 35
35 -
 36
36 -
 37
37 -
 38
38 -
 39
39 -
 40
40 -
 41
41 -
 42
42 -
 43
43 -
 44
44 -
 45
45 -
 46
46 -
 47
47 -
 48
48 -
 49
49 -
 50
50 -
 51
51 -
 52
52 -
53
-
54
-
55
-
56
-
57
-
58
-
59
-
60
-
61
-
62
-
63
-
64
-
65
-
66
-
67
-
68
-
69
-
70
-
71
-
72
-
73
-
74
-
75
-
76
-
77
-
78
-
79
-
80
-
81
-
82
-
83
-
84
-
85
-
86
-
87
-
88
-
89
-
90
-
91
-
92
-
93
-
94
-
95
-
96
-
97
-
98
-
99
-
100
-
101
-
102
-
103
-
104
-
105
-
106
-
107
-
108
-
109
-
110
-
111
-
112
-
113
-
114
-
115
-
116
-
117
-
118
-
119
-
120
-
121
-
122
-
123
-
124
-
125
-
126
-
127
-
128
-
129
-
130
 |
 |

PART II
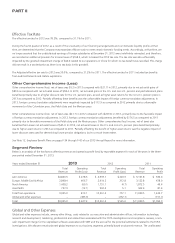
Effective Tax Rate
The effective tax rate for 2013 was 100.6%, compared to 78.2% for 2012.
During the fourth quarter of 2012, as a result of the uncertainty of our financing arrangements and our domestic liquidity profile at that
time, we determined that the Company may repatriate offshore cash to meet certain domestic funding needs. Accordingly, at that time, we
asserted that the undistributed earnings of foreign subsidiaries were no longer indefinitely reinvested, and therefore, we recorded an
additional provision for income taxes of $168.3 related to the incremental U.S, taxes associated with the unremitted foreign earnings, which
increased the 2012 tax rate. The effective tax rate in 2012 was also unfavorably impacted by the non-cash impairment charges for goodwill
and intangible assets associated with our China business of $44.0.
At December 31, 2013, we continue to assert that the Company’s foreign earnings may not be indefinitely reinvested, as a result of our
domestic liquidity profile. In this regard, the 2013 effective tax rate was favorably impacted primarily due to the country mix of earnings and
the lower expected tax cost to repatriate the undistributed earnings of our foreign subsidiaries. The 2013 effective tax rate was also
unfavorably impacted by the non-cash impairment charges for goodwill and intangible assets associated with our China business of $42.1.
The rate was further impacted unfavorably by the devaluation of the Venezuelan currency in conjunction with highly inflationary accounting
discussed further within “Segment Review – Latin America” in this MD&A, and the $89.0 accrual for the potential settlements related to the
FCPA investigations. Additionally, the rate was negatively impacted by a valuation allowance for deferred tax assets related to China in the
third quarter of $9.2 and Venezuela in the fourth quarter of $41.8. The valuation allowance in Venezuela was due to the impact of higher
than expected inflation on our taxable income which negatively impacted the likelihood we would realize existing deferred tax assets. Given
the short life of the net operating loss carryforward periods for these markets, we determined that it was more likely than not that we would
not use these carryforward losses before they expire.
The Adjusted effective tax rate for 2013 was 30.3%, compared to 35.0% for 2012, primarily due to the country mix of earnings and the
lower expected tax cost to repatriate the undistributed earnings of our foreign subsidiaries.
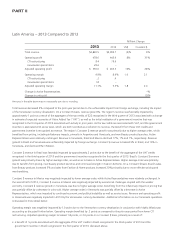
2012 Compared to 2011
Revenue
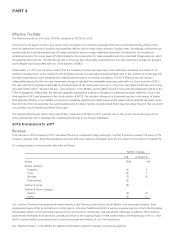
Total revenue in 2012 compared to 2011 decreased 5% due to unfavorable foreign exchange. Constant $ revenue increased 1% due to a 1%
increase in average order. Active Representatives and units sold were relatively unchanged, while the net impact of price and mix increased 1%.
On a category basis, revenue growth rates were as follows:
%/Point Change
US$ Constant $
Beauty (5)% 1%
Beauty Category:
Fragrance (4) 2
Color (6) 1
Skincare (7) (1)
Personal care (6) –
Fashion & Home (4) –
Fashion & Home Category:
Fashion (4) (1)
Home (4) 2
Our Constant $ revenue was impacted by improvements in Latin America, particularly in Brazil, Mexico, and Venezuela; however, these
improvements were offset by net declines in other regions. In Europe, Middle East & Africa we saw a revenue decline in the United Kingdom
that partially reflects a continued weak macroeconomic environment, competition, and executional challenges. In addition, North America
experienced challenging financial results, partially as a result of the ongoing impact of field transformation and redistricting in the U.S. Asia
Pacific’s revenue decline was primarily due to continuing weak performance of our China operations.
See “Segment Review” in this MD&A for additional information related to changes in revenue by segment.