Avon 2013 Annual Report Download - page 52
Download and view the complete annual report
Please find page 52 of the 2013 Avon annual report below. You can navigate through the pages in the report by either clicking on the pages listed below, or by using the keyword search tool below to find specific information within the annual report.-
 1
1 -
2
-
3
-
4
-
5
-
6
-
7
-
8
-
9
-
10
-
11
-
12
-
13
-
14
-
15
-
16
-
17
-
18
-
19
-
20
-
21
-
22
-
23
-
24
-
25
-
26
-
27
-
28
-
29
-
30
-
31
-
32
-
33
-
34
-
35
-
36
-
37
-
38
-
39
-
40
-
41
-
 42
42 -
 43
43 -
 44
44 -
 45
45 -
 46
46 -
 47
47 -
 48
48 -
 49
49 -
 50
50 -
 51
51 -
 52
52 -
 53
53 -
 54
54 -
 55
55 -
 56
56 -
 57
57 -
 58
58 -
 59
59 -
 60
60 -
 61
61 -
 62
62 -
63
-
64
-
65
-
66
-
67
-
68
-
69
-
70
-
71
-
72
-
73
-
74
-
75
-
76
-
77
-
78
-
79
-
80
-
81
-
82
-
83
-
84
-
85
-
86
-
87
-
88
-
89
-
90
-
91
-
92
-
93
-
94
-
95
-
96
-
97
-
98
-
99
-
100
-
101
-
102
-
103
-
104
-
105
-
106
-
107
-
108
-
109
-
110
-
111
-
112
-
113
-
114
-
115
-
116
-
117
-
118
-
119
-
120
-
121
-
122
-
123
-
124
-
125
-
126
-
127
-
128
-
129
-
130
 |
 |

PART II
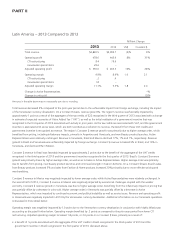
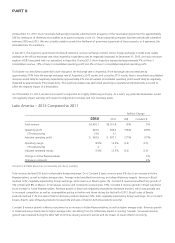
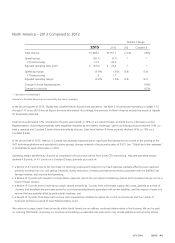
North America – 2012 Compared to 2011
%/Point Change
2012 2011 US$ Constant $
Total revenue $1,751.1 $1,872.5 (6)% (6)%
Operating (loss) profit (4.7) 49.4 * *
CTI restructuring 30.5 24.7
Adjusted operating profit $ 25.8 $ 74.1 (65)% (65)%
Operating margin (.3)% 2.6% (2.9) (2.9)
CTI restructuring 1.7 1.3
Adjusted operating margin 1.5% 4.0% (2.5) (2.5)
Change in Active Representatives (12)%
Change in units sold (6)%
Amounts in the table above may not necessarily sum due to rounding.
Total revenue decreased 6% on both a reported and Constant $ basis, primarily due to a decrease in Active Representatives, partially offset
by larger average order which was primarily due to Representative mix. Sales from Beauty products declined 8%, or 7% on a Constant $
basis. Sales from Fashion & Home products declined 6%, on both a reported and Constant $ basis.
Operating margin was negatively impacted by .4 points as compared to the prior-year period from higher CTI restructuring. Adjusted
operating margin declined 2.5 points on both a reported and Constant $ basis, primarily as a result of:
• a decline of 2.5 points from higher Representative and sales leader investment, primarily due to costs related to the One Simple Sales
Model implementation in the U.S.;
• a decline of 1.6 points due to lower gross margin caused primarily by approximately .8 points from the unfavorable net impact of mix and
pricing and approximately .7 points from higher supply chain costs primarily due to higher obsolescence costs. These were partially offset
by a benefit of out-of-period adjustments associated with vendor liabilities of .3 points;
• a decline of .4 points from higher brochure costs;
• a benefit of 1.7 points from lower overhead costs, primarily due to headcount reduction; and
• a benefit of .5 points from lower advertising costs.