Avon 2013 Annual Report Download - page 40
Download and view the complete annual report
Please find page 40 of the 2013 Avon annual report below. You can navigate through the pages in the report by either clicking on the pages listed below, or by using the keyword search tool below to find specific information within the annual report.-
 1
1 -
2
-
3
-
4
-
5
-
6
-
7
-
8
-
9
-
10
-
11
-
12
-
13
-
14
-
15
-
16
-
17
-
18
-
19
-
20
-
21
-
22
-
23
-
24
-
25
-
26
-
27
-
28
-
29
-
 30
30 -
 31
31 -
 32
32 -
 33
33 -
 34
34 -
 35
35 -
 36
36 -
 37
37 -
 38
38 -
 39
39 -
 40
40 -
 41
41 -
 42
42 -
 43
43 -
 44
44 -
 45
45 -
 46
46 -
 47
47 -
 48
48 -
 49
49 -
 50
50 -
51
-
52
-
53
-
54
-
55
-
56
-
57
-
58
-
59
-
60
-
61
-
62
-
63
-
64
-
65
-
66
-
67
-
68
-
69
-
70
-
71
-
72
-
73
-
74
-
75
-
76
-
77
-
78
-
79
-
80
-
81
-
82
-
83
-
84
-
85
-
86
-
87
-
88
-
89
-
90
-
91
-
92
-
93
-
94
-
95
-
96
-
97
-
98
-
99
-
100
-
101
-
102
-
103
-
104
-
105
-
106
-
107
-
108
-
109
-
110
-
111
-
112
-
113
-
114
-
115
-
116
-
117
-
118
-
119
-
120
-
121
-
122
-
123
-
124
-
125
-
126
-
127
-
128
-
129
-
130
 |
 |

PART II
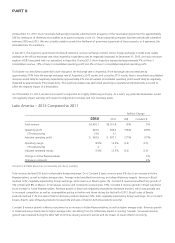
2013 Compared to 2012
Revenue
Total revenue in 2013 compared to 2012 declined 6% compared to the prior-year period, partially due to unfavorable foreign exchange.
Constant $ revenue declined 1%, as a 2% decrease in Active Representatives was partially offset by a 1% increase in average order. Units
sold decreased 5% while the net impact of price and mix increased 4%, as pricing benefited from inflationary impacts in Latin America,
primarily in Argentina and Venezuela.
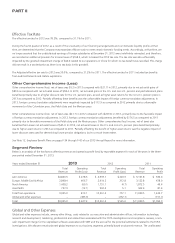
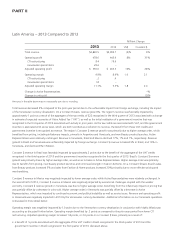
On a category basis, revenue growth rates were as follows:
%/Point Change
US$ Constant $
Beauty (7)% (2)%
Beauty Category:
Fragrance (4) 2
Color (6) (1)
Skincare (12) (8)
Personal care (7) (3)
Fashion & Home (4) 1
Fashion & Home Category:
Fashion (7) (4)
Home 39
Our Constant $ revenue was impacted by net declines in North America and Asia Pacific; however, these declines were partially offset by
improvements in Latin America and Europe, Middle East & Africa. Growth in Latin America was driven by Brazil, particularly in Fashion &
Home, and Venezuela primarily due to inflationary pricing, which was partially offset by executional challenges in Mexico in the second half
of 2013. In Europe, Middle East & Africa, growth was driven by South Africa, Russia and Turkey, which was partially offset by a revenue
decline in the United Kingdom. North America experienced deteriorating financial results, primarily as a result of the decline in Active
Representatives. Asia Pacific’s revenue decline was primarily due to continuing weak performance of our China operations and operational
challenges in the Philippines.
See “Segment Review” in this MD&A for additional information related to changes in revenue by segment.
Operating Margin
Operating margin decreased 70 basis points and Adjusted operating margin increased 130 basis points compared to 2012. The increase in
Adjusted operating margin includes the benefits associated with the $400M Cost Savings Initiative. The decrease in operating margin and
increase in Adjusted operating margin are discussed further below in “Gross Margin”, “Selling, General and Administrative Expenses” and
“Impairment of Goodwill and Intangible Asset.”
Gross Margin
Gross margin and Adjusted gross margin increased by 90 basis points and 130 basis points, respectively, compared to 2012. The increase in
Adjusted gross margin was primarily due to the following:
• an increase of 70 basis points due to lower supply chain costs, largely due to 60 points from lower freight costs, primarily in Latin America
due to reduced usage of air freight;
• an increase of 70 basis points due to the favorable net impact of mix and pricing, primarily in Latin America including benefits in pricing
due to the realization of price increases in advance of costs in markets experiencing relatively high inflation (Venezuela and Argentina),
while mix negatively impacted gross margin due to higher growth in Fashion & Home;
• a decrease of 60 basis points due to the unfavorable impact of foreign exchange; and
• various other insignificant items that contributed to the increase in gross margin and Adjusted gross margin.