Avon 2013 Annual Report Download - page 50
Download and view the complete annual report
Please find page 50 of the 2013 Avon annual report below. You can navigate through the pages in the report by either clicking on the pages listed below, or by using the keyword search tool below to find specific information within the annual report.-
 1
1 -
2
-
3
-
4
-
5
-
6
-
7
-
8
-
9
-
10
-
11
-
12
-
13
-
14
-
15
-
16
-
17
-
18
-
19
-
20
-
21
-
22
-
23
-
24
-
25
-
26
-
27
-
28
-
29
-
30
-
31
-
32
-
33
-
34
-
35
-
36
-
37
-
38
-
39
-
 40
40 -
 41
41 -
 42
42 -
 43
43 -
 44
44 -
 45
45 -
 46
46 -
 47
47 -
 48
48 -
 49
49 -
 50
50 -
 51
51 -
 52
52 -
 53
53 -
 54
54 -
 55
55 -
 56
56 -
 57
57 -
 58
58 -
 59
59 -
 60
60 -
61
-
62
-
63
-
64
-
65
-
66
-
67
-
68
-
69
-
70
-
71
-
72
-
73
-
74
-
75
-
76
-
77
-
78
-
79
-
80
-
81
-
82
-
83
-
84
-
85
-
86
-
87
-
88
-
89
-
90
-
91
-
92
-
93
-
94
-
95
-
96
-
97
-
98
-
99
-
100
-
101
-
102
-
103
-
104
-
105
-
106
-
107
-
108
-
109
-
110
-
111
-
112
-
113
-
114
-
115
-
116
-
117
-
118
-
119
-
120
-
121
-
122
-
123
-
124
-
125
-
126
-
127
-
128
-
129
-
130
 |
 |

PART II
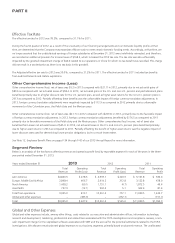
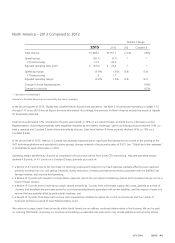
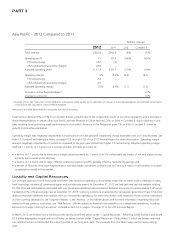
Europe, Middle East & Africa – 2012 Compared to 2011
%/Point Change
2012 2011 US$ Constant $
Total revenue $2,914.2 $3,122.8 (7)% (1)%
Operating profit 312.8 478.9 (35)% (27)%
CTI restructuring 11.8 5.3
Adjusted operating profit $ 324.6 $ 484.2 (33)% (26)%
Operating margin 10.7% 15.3% (4.6) (4.1)
CTI restructuring .4 .2
Adjusted operating margin 11.1% 15.5% (4.4) (3.9)
Change in Active Representatives –%
Change in units sold –%
Amounts in the table above may not necessarily sum due to rounding.
Total revenue declined 7% primarily due to unfavorable foreign exchange. On a Constant $ basis, revenue declined 1%, impacted by
approximately 1 point due to a nonrecurring item in the prior-year period. During 2011, the United Kingdom’s revenue benefited from the
settlement of a long time dispute associated with an estimated VAT liability. The region’s Constant $ revenue was impacted by declines in
the United Kingdom and Turkey, partially reflecting a continued weak macroeconomic environment, competition and executional
challenges. Growth in South Africa partially offset these declines.
In Russia, revenue declined 5%, impacted by unfavorable foreign exchange. Russia’s revenue was flat on a Constant $ basis, as higher
average order was offset by a decrease in Active Representatives. In the United Kingdom, revenue and Constant $ revenue declined 10%.
Revenue in the United Kingdom was negatively impacted by a decrease in Active Representatives, as well as by approximately 4 points due
to the benefit of the VAT settlement in the prior-year period that did not recur in 2012. In Turkey, revenue declined 10%, or 3% on a
Constant $ basis, due to lower average order. In South Africa, revenue declined 2%, impacted by unfavorable foreign exchange. On a
Constant $ basis, South Africa’s revenue grew 11% primarily due to higher average order and growth in Active Representatives.
Operating margin was negatively impacted by .2 points as compared to the prior-year period from higher CTI restructuring. Adjusted
operating margin declined 4.4 points, or 3.9 points on a Constant $ basis, primarily as a result of:
• a nonrecurring benefit of .4 points associated with the VAT settlement in the United Kingdom that occurred in 2011;
• a decline of 2.0 points due to lower gross margin caused primarily by 1.4 points from higher supply chain costs due to foreign exchange,
primarily due to the weakening of the Turkish Lira against the Euro, as well as increased product costs in Fashion and Home. The
unfavorable net pricing and mix negatively impacted gross margin by .9 points, driven by smart value offerings; and
• a decline of .9 points from higher bad debt expense primarily due to a higher provision to increase reserves for bad debt in South Africa as
a result of growth in new territories, of which .4 points was an out-of-period adjustment, and was also negatively impacted by a change
in estimate of the collection of our receivables.