Avon 2013 Annual Report Download - page 79
Download and view the complete annual report
Please find page 79 of the 2013 Avon annual report below. You can navigate through the pages in the report by either clicking on the pages listed below, or by using the keyword search tool below to find specific information within the annual report.-
 1
1 -
2
-
3
-
4
-
5
-
6
-
7
-
8
-
9
-
10
-
11
-
12
-
13
-
14
-
15
-
16
-
17
-
18
-
19
-
20
-
21
-
22
-
23
-
24
-
25
-
26
-
27
-
28
-
29
-
30
-
31
-
32
-
33
-
34
-
35
-
36
-
37
-
38
-
39
-
40
-
41
-
42
-
43
-
44
-
45
-
46
-
47
-
48
-
49
-
50
-
51
-
52
-
53
-
54
-
55
-
56
-
57
-
58
-
59
-
60
-
61
-
62
-
63
-
64
-
65
-
66
-
67
-
68
-
 69
69 -
 70
70 -
 71
71 -
 72
72 -
 73
73 -
 74
74 -
 75
75 -
 76
76 -
 77
77 -
 78
78 -
 79
79 -
 80
80 -
 81
81 -
 82
82 -
 83
83 -
 84
84 -
 85
85 -
 86
86 -
 87
87 -
 88
88 -
 89
89 -
90
-
91
-
92
-
93
-
94
-
95
-
96
-
97
-
98
-
99
-
100
-
101
-
102
-
103
-
104
-
105
-
106
-
107
-
108
-
109
-
110
-
111
-
112
-
113
-
114
-
115
-
116
-
117
-
118
-
119
-
120
-
121
-
122
-
123
-
124
-
125
-
126
-
127
-
128
-
129
-
130
 |
 |
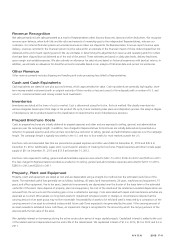
Revenue Recognition
Net sales primarily include sales generated as a result of Representative orders less any discounts, taxes and other deductions. We recognize
revenue upon delivery, when both title and the risks and rewards of ownership pass to the independent Representatives, who are our
customers. Our internal financial systems accumulate revenues as orders are shipped to the Representative. Since we report revenue upon
delivery, revenues recorded in the financial system must be reduced for an estimate of the financial impact of those orders shipped but not
delivered at the end of each reporting period. We use estimates in determining the adjustments to revenue and operating profit for orders
that have been shipped but not delivered as of the end of the period. These estimates are based on daily sales levels, delivery lead times,
gross margin and variable expenses. We also estimate an allowance for sales returns based on historical experience with product returns. In
addition, we estimate an allowance for doubtful accounts receivable based on an analysis of historical data and current circumstances.
Other Revenue
Other revenue primarily includes shipping and handling and order processing fees billed to Representatives.
Cash and Cash Equivalents
Cash equivalents are stated at cost plus accrued interest, which approximates fair value. Cash equivalents are generally high-quality, short-
term money market instruments with an original maturity of three months or less and consist of time deposits with a number of U.S. and
non-U.S. commercial banks and money market fund investments.
Inventories
Inventories are stated at the lower of cost or market. Cost is determined using the first-in, first-out method. We classify inventory into
various categories based upon their stage in the product life cycle, future marketing sales plans and disposition process. We assign a degree
of obsolescence risk to products based on this classification to determine the level of obsolescence provision.
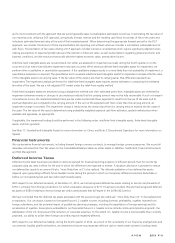
Prepaid Brochure Costs
Costs to prepare brochures are initially deferred to prepaid expenses and other and are expensed to selling, general, and administrative
expenses over the campaign length. In addition, fees charged to Representatives for brochures are initially deferred and presented as a
reduction to prepaid expenses and other and are recorded as a reduction to selling, general, and administrative expenses over the campaign
length. The campaign length is typically two weeks in the U.S. and two to four weeks for most markets outside the U.S.
Brochure costs and associated fees that are presented as prepaid expenses and other were $38.3 at December 31, 2013 and $45.4 at
December 31, 2012. Additionally, paper stock is purchased in advance of creating the brochures. Prepaid expenses and other include paper
supply of $9.1 at December 31, 2013 and $13.5 at December 31, 2012.
Brochure costs expensed to selling, general and administrative expenses amounted to $461.7 in 2013, $506.3 in 2012 and $505.6 in 2011.
The fees charged to Representatives recorded as a reduction to selling, general and administrative expenses amounted to $274.1 in 2013,
$285.9 in 2012 and $292.6 in 2011.
Property, Plant and Equipment
Property, plant and equipment are stated at cost and are depreciated using a straight-line method over the estimated useful lives of the
assets. The estimated useful lives generally are as follows: buildings, 45 years; land improvements, 20 years; machinery and equipment, 15
years; and office equipment, five to ten years. Leasehold improvements are depreciated over the shorter of the lease term or the estimated
useful life of the asset. Upon disposal of property, plant and equipment, the cost of the assets and the related accumulated depreciation are
removed from the accounts and the resulting gain or loss is reflected in earnings. Costs associated with repair and maintenance activities are
expensed as incurred. We evaluate our long-lived assets for impairment whenever events or changes in circumstances indicate that the
carrying amount of an asset group may not be recoverable. Recoverability of assets to be held and used is measured by a comparison of the
carrying amount of an asset to estimated undiscounted future cash flows expected to be generated by the asset. If the carrying amount of
an asset exceeds its estimated future cash flows, an impairment charge is recognized for the amount by which the carrying amount of the
asset exceeds the fair value of the asset.
We capitalize interest on borrowings during the active construction period of major capital projects. Capitalized interest is added to the cost
of the related asset and depreciated over the useful life of the related asset. We capitalized interest of $1.4 in 2013, $2.0 in 2012 and $.4 in
2011.
A V O N 2013 F-9