Allstate 2013 Annual Report Download - page 69
Download and view the complete annual report
Please find page 69 of the 2013 Allstate annual report below. You can navigate through the pages in the report by either clicking on the pages listed below, or by using the keyword search tool below to find specific information within the annual report.-
 1
1 -
2
-
3
-
4
-
5
-
6
-
7
-
8
-
9
-
10
-
11
-
12
-
13
-
14
-
15
-
16
-
17
-
18
-
19
-
20
-
21
-
22
-
23
-
24
-
25
-
26
-
27
-
28
-
29
-
30
-
31
-
32
-
33
-
34
-
35
-
36
-
37
-
38
-
39
-
40
-
41
-
42
-
43
-
44
-
45
-
46
-
47
-
48
-
49
-
50
-
51
-
52
-
53
-
54
-
55
-
56
-
57
-
58
-
 59
59 -
 60
60 -
 61
61 -
 62
62 -
 63
63 -
 64
64 -
 65
65 -
 66
66 -
 67
67 -
 68
68 -
 69
69 -
 70
70 -
 71
71 -
 72
72 -
 73
73 -
 74
74 -
 75
75 -
 76
76 -
 77
77 -
 78
78 -
 79
79 -
80
-
81
-
82
-
83
-
84
-
85
-
86
-
87
-
88
-
89
-
90
-
91
-
92
-
93
-
94
-
95
-
96
-
97
-
98
-
99
-
100
-
101
-
102
-
103
-
104
-
105
-
106
-
107
-
108
-
109
-
110
-
111
-
112
-
113
-
114
-
115
-
116
-
117
-
118
-
119
-
120
-
121
-
122
-
123
-
124
-
125
-
126
-
127
-
128
-
129
-
130
-
131
-
132
-
133
-
134
-
135
-
136
-
137
-
138
-
139
-
140
-
141
-
142
-
143
-
144
-
145
-
146
-
147
-
148
-
149
-
150
-
151
-
152
-
153
-
154
-
155
-
156
-
157
-
158
-
159
-
160
-
161
-
162
-
163
-
164
-
165
-
166
-
167
-
168
-
169
-
170
-
171
-
172
-
173
-
174
-
175
-
176
-
177
-
178
-
179
-
180
-
181
-
182
-
183
-
184
-
185
-
186
-
187
-
188
-
189
-
190
-
191
-
192
-
193
-
194
-
195
-
196
-
197
-
198
-
199
-
200
-
201
-
202
-
203
-
204
-
205
-
206
-
207
-
208
-
209
-
210
-
211
-
212
-
213
-
214
-
215
-
216
-
217
-
218
-
219
-
220
-
221
-
222
-
223
-
224
-
225
-
226
-
227
-
228
-
229
-
230
-
231
-
232
-
233
-
234
-
235
-
236
-
237
-
238
-
239
-
240
-
241
-
242
-
243
-
244
-
245
-
246
-
247
-
248
-
249
-
250
-
251
-
252
-
253
-
254
-
255
-
256
-
257
-
258
-
259
-
260
-
261
-
262
-
263
-
264
-
265
-
266
-
267
-
268
-
269
-
270
-
271
-
272
-
273
-
274
-
275
-
276
-
277
-
278
-
279
-
280
-
281
-
282
-
283
-
284
-
285
-
286
-
287
-
288
-
289
-
290
-
291
-
292
-
293
-
294
-
295
-
296
 |
 |

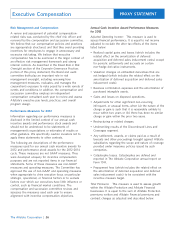
Allstate Protection premiums written is equal to the annual adjusted operating income return on equity is
Allstate Protection segment net premiums written calculated as the ratio of annual adjusted operating
adjusted to replace the actual amount of ceded income divided by the average of stockholder’s equity
reinsurance premium written for Allstate’s voluntary excluding unrealized net capital gains and losses at the
reinsurance programs and dispositions, if any, with the beginning and at the end of the year.
amount included in the target. Voluntary reinsurance Annual adjusted operating income is equal to net income
programs include all reinsurance placed through the adjusted to exclude the after tax effects of the items
reinsurance market including through reinsurance brokers listed below.
and investment bankers, and catastrophe treaties,
facultative and quota share agreements, catastrophe • Realized capital gains and losses (which includes the
bonds, and other types of arrangements. Allstate related effect on the amortization of deferred
Protection premiums written is reported in management’s acquisition and deferred sales inducement costs) except
discussion and analysis in the annual report on for periodic settlements and accruals on certain
Form 10-K. non-hedge derivative instruments.
Allstate Financial premiums and contract charges is equal • Valuation changes on embedded derivatives that are
to life and annuity premiums and contract charges not hedged (which includes the related effect on the
reported in the consolidated statement of operations amortization of deferred acquisition and deferred sales
adjusted to exclude premiums and contract charges inducement costs).
related to structured settlement annuities. • Business combination expenses and the amortization of
purchased intangible assets.
Net Investment Income: This measure is used to assess
the financial operating performance provided from • Gains and losses on disposed operations.
investments. It is equal to net investment income as • Adjustments for other significant non-recurring,
reported in the consolidated statement of operations, infrequent, or unusual items, when (a) the nature of the
adjusted to eliminate the effects of differences between charge or gain is such that it is reasonably unlikely to
actual monthly average assets under management (actual recur within two years or (b) there has been no similar
AUM) and the monthly average assets under charge or gain within the prior two years.
management assumed in determining the company’s
performance measure target for net investment income • Underwriting results of the Discontinued Lines and
(target AUM). It also excludes amounts for prepayment Coverages segment.
fees to be consistent with the incentive measure target. • Prepayment fees (which includes the related effect on
Actual net investment income is adjusted by the amount the amortization of deferred acquisition and deferred
equal to the amount of net investment income included in sales inducement costs) to be consistent with the
the company’s performance measure target divided by the incentive measure target.
target AUM times the difference between the target and In addition in computing annual adjusted operating
actual amounts of AUM. The net investment income income ROE, catastrophe losses will be adjusted to reflect
actual result was decreased because the actual AUM was a minimum or maximum amount of after-tax catastrophe
above the target AUM. losses if actual after-tax catastrophe losses are less than
Actual AUM equals the average of the thirteen month $1.1 billion or exceed $1.6 billion. In the 2012
end total investments, including the beginning and end of measurement period after tax catastrophe losses were
the annual period, as reported in the consolidated $1.5 billion and did not require adjustment. Catastrophe
statement of financial position, adjusted to exclude the losses are defined and reported in The Allstate
unrealized gain (loss) for fixed income, equity, short term Corporation annual report on Form 10-K.
securities and securities lending assets for each month.
Net Income: Net income will be calculated as reported in
Performance Stock Award Performance Measures for The Allstate Corporation annual report on Form 10-K
2012-2014 cycle financial statements.
Annual Adjusted Operating Income Return on Equity: This
measure is used to assess financial performance. The
57
Executive Compensation
| The Allstate Corporation
PROXY STATEMENT