Allstate 2013 Annual Report Download - page 158
Download and view the complete annual report
Please find page 158 of the 2013 Allstate annual report below. You can navigate through the pages in the report by either clicking on the pages listed below, or by using the keyword search tool below to find specific information within the annual report.-
 1
1 -
2
-
3
-
4
-
5
-
6
-
7
-
8
-
9
-
10
-
11
-
12
-
13
-
14
-
15
-
16
-
17
-
18
-
19
-
20
-
21
-
22
-
23
-
24
-
25
-
26
-
27
-
28
-
29
-
30
-
31
-
32
-
33
-
34
-
35
-
36
-
37
-
38
-
39
-
40
-
41
-
42
-
43
-
44
-
45
-
46
-
47
-
48
-
49
-
50
-
51
-
52
-
53
-
54
-
55
-
56
-
57
-
58
-
59
-
60
-
61
-
62
-
63
-
64
-
65
-
66
-
67
-
68
-
69
-
70
-
71
-
72
-
73
-
74
-
75
-
76
-
77
-
78
-
79
-
80
-
81
-
82
-
83
-
84
-
85
-
86
-
87
-
88
-
89
-
90
-
91
-
92
-
93
-
94
-
95
-
96
-
97
-
98
-
99
-
100
-
101
-
102
-
103
-
104
-
105
-
106
-
107
-
108
-
109
-
110
-
111
-
112
-
113
-
114
-
115
-
116
-
117
-
118
-
119
-
120
-
121
-
122
-
123
-
124
-
125
-
126
-
127
-
128
-
129
-
130
-
131
-
132
-
133
-
134
-
135
-
136
-
137
-
138
-
139
-
140
-
141
-
142
-
143
-
144
-
145
-
146
-
147
-
 148
148 -
 149
149 -
 150
150 -
 151
151 -
 152
152 -
 153
153 -
 154
154 -
 155
155 -
 156
156 -
 157
157 -
 158
158 -
 159
159 -
 160
160 -
 161
161 -
 162
162 -
 163
163 -
 164
164 -
 165
165 -
 166
166 -
 167
167 -
 168
168 -
169
-
170
-
171
-
172
-
173
-
174
-
175
-
176
-
177
-
178
-
179
-
180
-
181
-
182
-
183
-
184
-
185
-
186
-
187
-
188
-
189
-
190
-
191
-
192
-
193
-
194
-
195
-
196
-
197
-
198
-
199
-
200
-
201
-
202
-
203
-
204
-
205
-
206
-
207
-
208
-
209
-
210
-
211
-
212
-
213
-
214
-
215
-
216
-
217
-
218
-
219
-
220
-
221
-
222
-
223
-
224
-
225
-
226
-
227
-
228
-
229
-
230
-
231
-
232
-
233
-
234
-
235
-
236
-
237
-
238
-
239
-
240
-
241
-
242
-
243
-
244
-
245
-
246
-
247
-
248
-
249
-
250
-
251
-
252
-
253
-
254
-
255
-
256
-
257
-
258
-
259
-
260
-
261
-
262
-
263
-
264
-
265
-
266
-
267
-
268
-
269
-
270
-
271
-
272
-
273
-
274
-
275
-
276
-
277
-
278
-
279
-
280
-
281
-
282
-
283
-
284
-
285
-
286
-
287
-
288
-
289
-
290
-
291
-
292
-
293
-
294
-
295
-
296
 |
 |

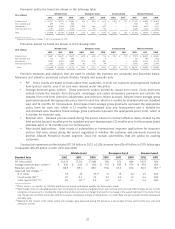
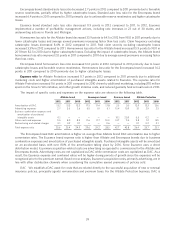
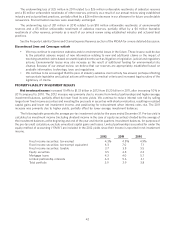
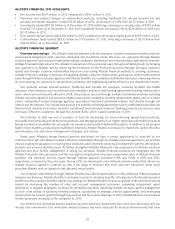
The underwriting loss of $25 million in 2011 related to a $26 million unfavorable reestimate of asbestos reserves
and a $5 million unfavorable reestimate of other reserves, primarily as a result of our annual review using established
industry and actuarial best practices, partially offset by a $26 million decrease in our allowance for future uncollectable
reinsurance. Environmental reserves were essentially unchanged.
The underwriting loss of $31 million in 2010 related to an $18 million unfavorable reestimate of environmental
reserves and a $5 million unfavorable reestimate of asbestos reserves, partially offset by a $4 million favorable
reestimate of other reserves, primarily as a result of our annual review using established industry and actuarial best
practices.
See the Property-Liability Claims and Claims Expense Reserves section of the MD&A for a more detailed discussion.
Discontinued Lines and Coverages outlook
• We may continue to experience asbestos and/or environmental losses in the future. These losses could be due
to the potential adverse impact of new information relating to new and additional claims or the impact of
resolving unsettled claims based on unanticipated events such as litigation or legislative, judicial and regulatory
actions. Environmental losses may also increase as the result of additional funding for environmental site
cleanup. Because of our annual review, we believe that our reserves are appropriately established based on
available information, technology, laws and regulations.
• We continue to be encouraged that the pace of industry asbestos claim activity has slowed, perhaps reflecting
various state legislative and judicial actions with respect to medical criteria and increased legal scrutiny of the
legitimacy of claims.
PROPERTY-LIABILITY INVESTMENT RESULTS
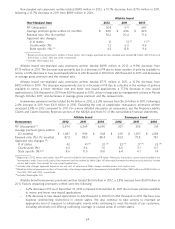
Net investment income increased 10.4% to $1.33 billion in 2012 from $1.20 billion in 2011, after increasing 1.0% in
2011 compared to 2010. The 2012 increase was primarily due to income from limited partnerships and higher average
investment balances, partially offset by lower fixed income yields. We continue to reduce interest rate risk by selling
longer term fixed income securities and investing the proceeds in securities with shorter maturities, resulting in realized
capital gains and lower net investment income, and positioning for reinvestment when interest rates rise. The 2011
increase was primarily due to higher yields, partially offset by lower average investment balances.
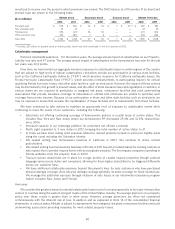
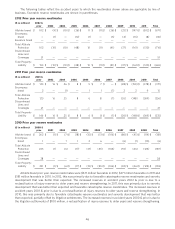
The following table presents the average pre-tax investment yields for the years ended December 31. Pre-tax yield is
calculated as investment income (including dividend income in the case of equity securities) divided by the average of
the investment balances at the beginning and end of the year and interim quarters. Investment balances, for purposes of
the pre-tax yield calculation, exclude unrealized capital gains and losses. Limited partnerships accounted for under the
equity method of accounting (‘‘EMA’’) are included in the 2012 yields since their income is reported in net investment
income.
2012 2011 2010
Fixed income securities: tax-exempt 4.3% 4.8% 4.9%
Fixed income securities: tax-exempt equivalent 6.3 7.0 7.1
Fixed income securities: taxable 3.7 3.8 3.5
Equity securities 3.5 2.8 2.3
Mortgage loans 4.3 4.0 5.7
Limited partnership interests 6.3 5.6 3.1
Total portfolio 3.9 3.9 3.8
42