Allstate 2013 Annual Report Download - page 39
Download and view the complete annual report
Please find page 39 of the 2013 Allstate annual report below. You can navigate through the pages in the report by either clicking on the pages listed below, or by using the keyword search tool below to find specific information within the annual report.-
 1
1 -
2
-
3
-
4
-
5
-
6
-
7
-
8
-
9
-
10
-
11
-
12
-
13
-
14
-
15
-
16
-
17
-
18
-
19
-
20
-
21
-
22
-
23
-
24
-
25
-
26
-
27
-
28
-
 29
29 -
 30
30 -
 31
31 -
 32
32 -
 33
33 -
 34
34 -
 35
35 -
 36
36 -
 37
37 -
 38
38 -
 39
39 -
 40
40 -
 41
41 -
 42
42 -
 43
43 -
 44
44 -
 45
45 -
 46
46 -
 47
47 -
 48
48 -
 49
49 -
50
-
51
-
52
-
53
-
54
-
55
-
56
-
57
-
58
-
59
-
60
-
61
-
62
-
63
-
64
-
65
-
66
-
67
-
68
-
69
-
70
-
71
-
72
-
73
-
74
-
75
-
76
-
77
-
78
-
79
-
80
-
81
-
82
-
83
-
84
-
85
-
86
-
87
-
88
-
89
-
90
-
91
-
92
-
93
-
94
-
95
-
96
-
97
-
98
-
99
-
100
-
101
-
102
-
103
-
104
-
105
-
106
-
107
-
108
-
109
-
110
-
111
-
112
-
113
-
114
-
115
-
116
-
117
-
118
-
119
-
120
-
121
-
122
-
123
-
124
-
125
-
126
-
127
-
128
-
129
-
130
-
131
-
132
-
133
-
134
-
135
-
136
-
137
-
138
-
139
-
140
-
141
-
142
-
143
-
144
-
145
-
146
-
147
-
148
-
149
-
150
-
151
-
152
-
153
-
154
-
155
-
156
-
157
-
158
-
159
-
160
-
161
-
162
-
163
-
164
-
165
-
166
-
167
-
168
-
169
-
170
-
171
-
172
-
173
-
174
-
175
-
176
-
177
-
178
-
179
-
180
-
181
-
182
-
183
-
184
-
185
-
186
-
187
-
188
-
189
-
190
-
191
-
192
-
193
-
194
-
195
-
196
-
197
-
198
-
199
-
200
-
201
-
202
-
203
-
204
-
205
-
206
-
207
-
208
-
209
-
210
-
211
-
212
-
213
-
214
-
215
-
216
-
217
-
218
-
219
-
220
-
221
-
222
-
223
-
224
-
225
-
226
-
227
-
228
-
229
-
230
-
231
-
232
-
233
-
234
-
235
-
236
-
237
-
238
-
239
-
240
-
241
-
242
-
243
-
244
-
245
-
246
-
247
-
248
-
249
-
250
-
251
-
252
-
253
-
254
-
255
-
256
-
257
-
258
-
259
-
260
-
261
-
262
-
263
-
264
-
265
-
266
-
267
-
268
-
269
-
270
-
271
-
272
-
273
-
274
-
275
-
276
-
277
-
278
-
279
-
280
-
281
-
282
-
283
-
284
-
285
-
286
-
287
-
288
-
289
-
290
-
291
-
292
-
293
-
294
-
295
-
296
 |
 |

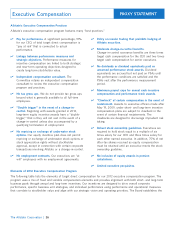
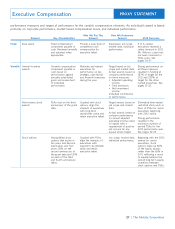
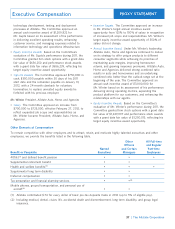
performance measures and ranges of performance for the variable compensation elements. An individual’s award is based
primarily on corporate performance, market based compensation levels, and individual performance.
Base salary Fixed compensation Provide a base level of Experience, job scope, 5 of 6 named
component payable in competitive cash market data, individual executives received a
cash. Reviewed annually compensation for performance. salary increase in 2012.
and adjusted when executive talent. Mr. Wilson’s salary has
appropriate. not been increased in
three years. See
pages 34-37.
Annual incentive Variable compensation Motivate and reward Target based on job Strong performance on
awards component payable in executives for scope and market data. all three measures
cash based on performance on key Actual awards based on resulted in funding at
performance against strategic, operational, company performance 187% of target for the
annually established and financial measures on three measures: CEO and 229% of
goals and assessment during the year. • Adjusted operating target for the other
of individual income named executives. See
performance. • Total premiums pages 31-32.
• Net investment
income
Individual contribution
to performance.
Performance stock PSAs vest on the third Coupled with stock Target awards based on Eliminated time-vested
awards anniversary of the grant options, align the job scope and market restricted stock units in
date. interests of executives data. favor of PSAs for senior
with long-term executives beginning
Actual awards based on
stockholder value and with 2012 award.
company performance
retain executive talent. on annual adjusted Strong performance
operating income return resulted in the
on equity with a maximum number of
requirement of positive earned PSAs for the
net income for any 2012 performance year.
payout above target. See pages 32-33.
Stock options Nonqualified stock Coupled with PSAs, Job scope, market data, Beginning with the 2012
options that expire in align the interests of individual performance. awards for senior
ten years and become executives with executives, stock
exercisable over four long-term stockholder options make up 50%
years: 50% on the value and retain of the equity awards
second anniversary of executive talent. rather than the 65% in
the grant date and 25% 2011, reflecting a move
on each of the third to equally balance the
and fourth anniversary overall long-term equity
dates. incentives between
stock options and PSAs.
27
Executive Compensation
Fixed
Variable
| The Allstate Corporation
PROXY STATEMENT
Why We Pay This How We Determine
Element Key Characteristics Element Amount 2012 Decisions