Allstate 2013 Annual Report Download - page 247
Download and view the complete annual report
Please find page 247 of the 2013 Allstate annual report below. You can navigate through the pages in the report by either clicking on the pages listed below, or by using the keyword search tool below to find specific information within the annual report.-
 1
1 -
2
-
3
-
4
-
5
-
6
-
7
-
8
-
9
-
10
-
11
-
12
-
13
-
14
-
15
-
16
-
17
-
18
-
19
-
20
-
21
-
22
-
23
-
24
-
25
-
26
-
27
-
28
-
29
-
30
-
31
-
32
-
33
-
34
-
35
-
36
-
37
-
38
-
39
-
40
-
41
-
42
-
43
-
44
-
45
-
46
-
47
-
48
-
49
-
50
-
51
-
52
-
53
-
54
-
55
-
56
-
57
-
58
-
59
-
60
-
61
-
62
-
63
-
64
-
65
-
66
-
67
-
68
-
69
-
70
-
71
-
72
-
73
-
74
-
75
-
76
-
77
-
78
-
79
-
80
-
81
-
82
-
83
-
84
-
85
-
86
-
87
-
88
-
89
-
90
-
91
-
92
-
93
-
94
-
95
-
96
-
97
-
98
-
99
-
100
-
101
-
102
-
103
-
104
-
105
-
106
-
107
-
108
-
109
-
110
-
111
-
112
-
113
-
114
-
115
-
116
-
117
-
118
-
119
-
120
-
121
-
122
-
123
-
124
-
125
-
126
-
127
-
128
-
129
-
130
-
131
-
132
-
133
-
134
-
135
-
136
-
137
-
138
-
139
-
140
-
141
-
142
-
143
-
144
-
145
-
146
-
147
-
148
-
149
-
150
-
151
-
152
-
153
-
154
-
155
-
156
-
157
-
158
-
159
-
160
-
161
-
162
-
163
-
164
-
165
-
166
-
167
-
168
-
169
-
170
-
171
-
172
-
173
-
174
-
175
-
176
-
177
-
178
-
179
-
180
-
181
-
182
-
183
-
184
-
185
-
186
-
187
-
188
-
189
-
190
-
191
-
192
-
193
-
194
-
195
-
196
-
197
-
198
-
199
-
200
-
201
-
202
-
203
-
204
-
205
-
206
-
207
-
208
-
209
-
210
-
211
-
212
-
213
-
214
-
215
-
216
-
217
-
218
-
219
-
220
-
221
-
222
-
223
-
224
-
225
-
226
-
227
-
228
-
229
-
230
-
231
-
232
-
233
-
234
-
235
-
236
-
 237
237 -
 238
238 -
 239
239 -
 240
240 -
 241
241 -
 242
242 -
 243
243 -
 244
244 -
 245
245 -
 246
246 -
 247
247 -
 248
248 -
 249
249 -
 250
250 -
 251
251 -
 252
252 -
 253
253 -
 254
254 -
 255
255 -
 256
256 -
 257
257 -
258
-
259
-
260
-
261
-
262
-
263
-
264
-
265
-
266
-
267
-
268
-
269
-
270
-
271
-
272
-
273
-
274
-
275
-
276
-
277
-
278
-
279
-
280
-
281
-
282
-
283
-
284
-
285
-
286
-
287
-
288
-
289
-
290
-
291
-
292
-
293
-
294
-
295
-
296
 |
 |

2010
Total gain
(loss)
Realized Life and Interest recognized
Net capital annuity credited to Operating in net
investment gains and contract contractholder costs and income on
income losses benefits funds expenses derivatives
Derivatives in fair value accounting hedging
relationships
Interest rate contracts $ (139) $ 9 $ — $ 11 $ — $ (119)
Foreign currency and interest rate contracts — (2) — (18) — (20)
Subtotal (139) 7 — (7) — (139)
Derivatives not designated as accounting hedging
instruments
Interest rate contracts — (496) — — — (496)
Equity and index contracts — (91) — 113 18 40
Embedded derivative financial instruments — (3) (28) 34 — 3
Foreign currency contracts — (10) — — (3) (13)
Credit default contracts — (8) — — — (8)
Other contracts — — — 3 — 3
Subtotal — (608) (28) 150 15 (471)
Total $ (139) $ (601) $ (28) $ 143 $ 15 $ (610)
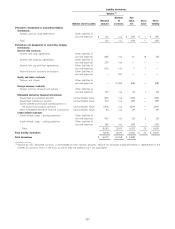
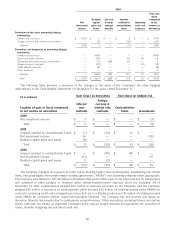
The following table provides a summary of the changes in fair value of the Company’s fair value hedging
relationships in the Consolidated Statements of Operations for the years ended December 31.
Gain (loss) on derivatives Gain (loss) on hedged risk
($ in millions)
Foreign
Interest currency &
Location of gain or (loss) recognized rate interest rate Contractholder
in net income on derivatives contracts contracts funds Investments
2012
Net investment income $ 3 $ — $ — $ (3)
Total $ 3 $ — $ — $ (3)
2011
Interest credited to contractholder funds $ (7) $ (34) $ 41 $ —
Net investment income 26 — — (26)
Realized capital gains and losses (8) — — —
Total $ 11 $ (34) $ 41 $ (26)
2010
Interest credited to contractholder funds $ — $ (48) $ 48 $ —
Net investment income (33) — — 33
Realized capital gains and losses 9 (2) — —
Total $ (24) $ (50) $ 48 $ 33
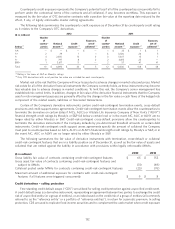
The Company manages its exposure to credit risk by utilizing highly rated counterparties, establishing risk control
limits, executing legally enforceable master netting agreements (‘‘MNAs’’) and obtaining collateral where appropriate.
The Company uses MNAs for OTC derivative transactions that permit either party to net payments due for transactions
and collateral is either pledged or obtained when certain predetermined exposure limits are exceeded. As of
December 31, 2012, counterparties pledged $29 million in cash and securities to the Company, and the Company
pledged $26 million in securities to counterparties which includes $25 million of collateral posted under MNAs for
contracts containing credit-risk-contingent provisions that are in a liability position and $1 million of collateral posted
under MNAs for contracts without credit-risk-contingent liabilities. The Company has not incurred any losses on
derivative financial instruments due to counterparty nonperformance. Other derivatives, including futures and certain
option contracts, are traded on organized exchanges which require margin deposits and guarantee the execution of
trades, thereby mitigating any potential credit risk.
131