Allstate 2013 Annual Report Download - page 181
Download and view the complete annual report
Please find page 181 of the 2013 Allstate annual report below. You can navigate through the pages in the report by either clicking on the pages listed below, or by using the keyword search tool below to find specific information within the annual report.-
 1
1 -
2
-
3
-
4
-
5
-
6
-
7
-
8
-
9
-
10
-
11
-
12
-
13
-
14
-
15
-
16
-
17
-
18
-
19
-
20
-
21
-
22
-
23
-
24
-
25
-
26
-
27
-
28
-
29
-
30
-
31
-
32
-
33
-
34
-
35
-
36
-
37
-
38
-
39
-
40
-
41
-
42
-
43
-
44
-
45
-
46
-
47
-
48
-
49
-
50
-
51
-
52
-
53
-
54
-
55
-
56
-
57
-
58
-
59
-
60
-
61
-
62
-
63
-
64
-
65
-
66
-
67
-
68
-
69
-
70
-
71
-
72
-
73
-
74
-
75
-
76
-
77
-
78
-
79
-
80
-
81
-
82
-
83
-
84
-
85
-
86
-
87
-
88
-
89
-
90
-
91
-
92
-
93
-
94
-
95
-
96
-
97
-
98
-
99
-
100
-
101
-
102
-
103
-
104
-
105
-
106
-
107
-
108
-
109
-
110
-
111
-
112
-
113
-
114
-
115
-
116
-
117
-
118
-
119
-
120
-
121
-
122
-
123
-
124
-
125
-
126
-
127
-
128
-
129
-
130
-
131
-
132
-
133
-
134
-
135
-
136
-
137
-
138
-
139
-
140
-
141
-
142
-
143
-
144
-
145
-
146
-
147
-
148
-
149
-
150
-
151
-
152
-
153
-
154
-
155
-
156
-
157
-
158
-
159
-
160
-
161
-
162
-
163
-
164
-
165
-
166
-
167
-
168
-
169
-
170
-
 171
171 -
 172
172 -
 173
173 -
 174
174 -
 175
175 -
 176
176 -
 177
177 -
 178
178 -
 179
179 -
 180
180 -
 181
181 -
 182
182 -
 183
183 -
 184
184 -
 185
185 -
 186
186 -
 187
187 -
 188
188 -
 189
189 -
 190
190 -
 191
191 -
192
-
193
-
194
-
195
-
196
-
197
-
198
-
199
-
200
-
201
-
202
-
203
-
204
-
205
-
206
-
207
-
208
-
209
-
210
-
211
-
212
-
213
-
214
-
215
-
216
-
217
-
218
-
219
-
220
-
221
-
222
-
223
-
224
-
225
-
226
-
227
-
228
-
229
-
230
-
231
-
232
-
233
-
234
-
235
-
236
-
237
-
238
-
239
-
240
-
241
-
242
-
243
-
244
-
245
-
246
-
247
-
248
-
249
-
250
-
251
-
252
-
253
-
254
-
255
-
256
-
257
-
258
-
259
-
260
-
261
-
262
-
263
-
264
-
265
-
266
-
267
-
268
-
269
-
270
-
271
-
272
-
273
-
274
-
275
-
276
-
277
-
278
-
279
-
280
-
281
-
282
-
283
-
284
-
285
-
286
-
287
-
288
-
289
-
290
-
291
-
292
-
293
-
294
-
295
-
296
 |
 |

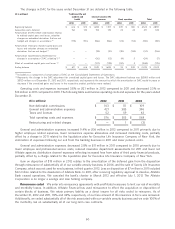
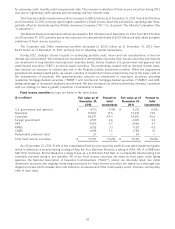
The following table summarizes by state the fair value, amortized cost and credit rating of our municipal bonds,
excluding $938 million of pre-refunded bonds, as of December 31, 2012.
($ in millions) State Average
general Local general Fair Amortized credit
State obligation obligation Revenue (1) value cost rating
Texas $ 32 $ 385 $ 571 $ 988 $ 890 Aa
California 88 452 446 986 905 A
Florida 135 134 522 791 744 Aa
New York 27 102 590 719 674 Aa
Pennsylvania 110 89 275 474 458 Aa
Missouri 65 127 260 452 423 A
Michigan 64 96 283 443 410 Aa
Ohio 99 159 170 428 388 Aa
Illinois — 115 286 401 353 A
Washington 26 50 271 347 322 Aa
All others 1,164 1,461 3,477 6,102 5,707 Aa
Total $ 1,810 $ 3,170 $ 7,151 $ 12,131 $ 11,274 Aa
(1) The nature of the activities supporting revenue bonds is highly diversified and includes transportation, health care, industrial development,
housing, higher education, utilities, recreation/convention centers and other activities.
Our practice for acquiring and monitoring municipal bonds is predominantly based on the underlying credit quality
of the primary obligor. We currently rely on the primary obligor to pay all contractual cash flows and are not relying on
bond insurers for payments. As a result of downgrades in the insurers’ credit ratings, the ratings of the insured municipal
bonds generally reflect the underlying ratings of the primary obligor. As of December 31, 2012, 99.6% of our insured
municipal bond portfolio is rated investment grade.
ARS totaled $424 million as of December 31, 2012 with an unrealized net capital loss of $48 million. Our holdings
primarily have a credit rating of Aaa and Aa. As of December 31, 2012, our ARS backed by student loans portfolio of
$394 million was 76% to 100% insured by the U.S. Department of Education. All of our ARS holdings are experiencing
failed auctions and we receive the failed auction rate or, for those which contain maximum reset rate formulas, we
receive the contractual maximum rate. We anticipate that failed auctions may persist and most of our holdings will
continue to pay the failed auction rate or, for those that contain maximum rate reset formulas, the maximum rate.
Auctions continue to be conducted as scheduled for each of the securities.
Corporate bonds, including publicly traded and privately placed, totaled $48.54 billion as of December 31, 2012, with
an unrealized net capital gain of $3.59 billion. Privately placed securities primarily consist of corporate issued senior
debt securities that are directly negotiated with the borrower or are in unregistered form.
Our $14.48 billion portfolio of privately placed securities is broadly diversified by issuer, industry sector and
country. The portfolio is made up of 518 issuers. Privately placed corporate obligations contain structural security
features such as financial covenants and call protections that provide investors greater protection against credit
deterioration, reinvestment risk or fluctuations in interest rates than those typically found in publicly registered debt
securities. Additionally, investments in these securities are made after extensive due diligence of the issuer, typically
including direct discussions with senior management and on-site visits to company facilities. Ongoing monitoring
includes direct periodic dialog with senior management of the issuer and continuous monitoring of operating
performance and financial position. Every issue not rated by an independent rating agency is internally rated with a
formal rating affirmation at least once a year.
Foreign government securities totaled $2.52 billion as of December 31, 2012, with 100% rated investment grade and
an unrealized net capital gain of $227 million. Of these securities, 55.0% are in Canadian governmental and provincial
securities, 35.4% of which are held by our Canadian companies, 16.2% are backed by the U.S. government and the
remaining 28.8% are highly diversified in other foreign governments.
ABS, RMBS and CMBS are structured securities that are primarily collateralized by residential and commercial real
estate loans and other consumer or corporate borrowings. The cash flows from the underlying collateral paid to the
securitization trust are generally applied in a pre-determined order and are designed so that each security issued by the
trust, typically referred to as a ‘‘class’’, qualifies for a specific original rating. For example, the ‘‘senior’’ portion or ‘‘top’’ of
the capital structure, or rating class, which would originally qualify for a rating of Aaa typically has priority in receiving
65