Allstate 2013 Annual Report Download - page 198
Download and view the complete annual report
Please find page 198 of the 2013 Allstate annual report below. You can navigate through the pages in the report by either clicking on the pages listed below, or by using the keyword search tool below to find specific information within the annual report.-
 1
1 -
2
-
3
-
4
-
5
-
6
-
7
-
8
-
9
-
10
-
11
-
12
-
13
-
14
-
15
-
16
-
17
-
18
-
19
-
20
-
21
-
22
-
23
-
24
-
25
-
26
-
27
-
28
-
29
-
30
-
31
-
32
-
33
-
34
-
35
-
36
-
37
-
38
-
39
-
40
-
41
-
42
-
43
-
44
-
45
-
46
-
47
-
48
-
49
-
50
-
51
-
52
-
53
-
54
-
55
-
56
-
57
-
58
-
59
-
60
-
61
-
62
-
63
-
64
-
65
-
66
-
67
-
68
-
69
-
70
-
71
-
72
-
73
-
74
-
75
-
76
-
77
-
78
-
79
-
80
-
81
-
82
-
83
-
84
-
85
-
86
-
87
-
88
-
89
-
90
-
91
-
92
-
93
-
94
-
95
-
96
-
97
-
98
-
99
-
100
-
101
-
102
-
103
-
104
-
105
-
106
-
107
-
108
-
109
-
110
-
111
-
112
-
113
-
114
-
115
-
116
-
117
-
118
-
119
-
120
-
121
-
122
-
123
-
124
-
125
-
126
-
127
-
128
-
129
-
130
-
131
-
132
-
133
-
134
-
135
-
136
-
137
-
138
-
139
-
140
-
141
-
142
-
143
-
144
-
145
-
146
-
147
-
148
-
149
-
150
-
151
-
152
-
153
-
154
-
155
-
156
-
157
-
158
-
159
-
160
-
161
-
162
-
163
-
164
-
165
-
166
-
167
-
168
-
169
-
170
-
171
-
172
-
173
-
174
-
175
-
176
-
177
-
178
-
179
-
180
-
181
-
182
-
183
-
184
-
185
-
186
-
187
-
 188
188 -
 189
189 -
 190
190 -
 191
191 -
 192
192 -
 193
193 -
 194
194 -
 195
195 -
 196
196 -
 197
197 -
 198
198 -
 199
199 -
 200
200 -
 201
201 -
 202
202 -
 203
203 -
 204
204 -
 205
205 -
 206
206 -
 207
207 -
 208
208 -
209
-
210
-
211
-
212
-
213
-
214
-
215
-
216
-
217
-
218
-
219
-
220
-
221
-
222
-
223
-
224
-
225
-
226
-
227
-
228
-
229
-
230
-
231
-
232
-
233
-
234
-
235
-
236
-
237
-
238
-
239
-
240
-
241
-
242
-
243
-
244
-
245
-
246
-
247
-
248
-
249
-
250
-
251
-
252
-
253
-
254
-
255
-
256
-
257
-
258
-
259
-
260
-
261
-
262
-
263
-
264
-
265
-
266
-
267
-
268
-
269
-
270
-
271
-
272
-
273
-
274
-
275
-
276
-
277
-
278
-
279
-
280
-
281
-
282
-
283
-
284
-
285
-
286
-
287
-
288
-
289
-
290
-
291
-
292
-
293
-
294
-
295
-
296
 |
 |

outstanding at any point in time under the combination of the commercial paper program and the credit facility
cannot exceed the amount that can be borrowed under the credit facility.
• A universal shelf registration statement was filed with the Securities and Exchange Commission on April 30, 2012.
We can use this shelf registration to issue an unspecified amount of debt securities, common stock (including
421 million shares of treasury stock as of December 31, 2012), preferred stock, depositary shares, warrants, stock
purchase contracts, stock purchase units and securities of trust subsidiaries. The specific terms of any securities we
issue under this registration statement will be provided in the applicable prospectus supplements.
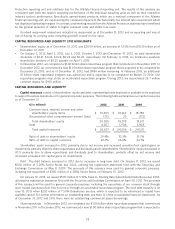
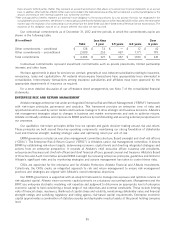
Liquidity exposure Contractholder funds were $39.32 billion as of December 31, 2012. The following table
summarizes contractholder funds by their contractual withdrawal provisions as of December 31, 2012.
($ in millions) Percent to
total
Not subject to discretionary withdrawal $ 6,012 15.3%
Subject to discretionary withdrawal with adjustments:
Specified surrender charges (1) 13,170 33.5
Market value adjustments (2) 5,382 13.7
Subject to discretionary withdrawal without adjustments (3) 14,755 37.5
Total contractholder funds (4) $ 39,319 100.0%
(1) Includes $6.81 billion of liabilities with a contractual surrender charge of less than 5% of the account balance.
(2) $4.45 billion of the contracts with market value adjusted surrenders have a 30-45 day period at the end of their initial
and subsequent interest rate guarantee periods (which are typically 5 or 6 years) during which there is no surrender
charge or market value adjustment.
(3) 76% of these contracts have a minimum interest crediting rate guarantee of 3% or higher.
(4) Includes $1.12 billion of contractholder funds on variable annuities reinsured to The Prudential Insurance Company of
America, a subsidiary of Prudential Financial Inc., in 2006.
While we are able to quantify remaining scheduled maturities for our institutional products, anticipating retail
product surrenders is less precise. Retail life and annuity products may be surrendered by customers for a variety of
reasons. Reasons unique to individual customers include a current or unexpected need for cash or a change in life
insurance coverage needs. Other key factors that may impact the likelihood of customer surrender include the level of
the contract surrender charge, the length of time the contract has been in force, distribution channel, market interest
rates, equity market conditions and potential tax implications. In addition, the propensity for retail life insurance policies
to lapse is lower than it is for fixed annuities because of the need for the insured to be re-underwritten upon policy
replacement. Surrenders and partial withdrawals for our retail annuities decreased 20.1% in 2012 compared to 2011. The
annualized surrender and partial withdrawal rate on deferred fixed annuities and interest-sensitive life insurance
products, based on the beginning of year contractholder funds, was 11.3% and 12.6% in 2012 and 2011, respectively.
Allstate Financial strives to promptly pay customers who request cash surrenders; however, statutory regulations
generally provide up to six months in most states to fulfill surrender requests.
Our institutional products are primarily funding agreements sold to unaffiliated trusts used to back medium-term
notes. As of December 31, 2012, total institutional products outstanding were $1.84 billion, with scheduled maturities of
$1.75 billion in April of 2013 and $85 million in 2016.
Our asset-liability management practices limit the differences between the cash flows generated by our investment
portfolio and the expected cash flow requirements of our life insurance, annuity and institutional product obligations.
Certain remote events and circumstances could constrain our liquidity. Those events and circumstances include, for
example, a catastrophe resulting in extraordinary losses, a downgrade in our senior long-term debt rating of A3, A- and
a- (from Moody’s, S&P and A.M. Best, respectively) to non-investment grade status of below Baa3/BBB-/bb, a
downgrade in AIC’s financial strength rating from Aa3, AA- and A+ (from Moody’s, S&P and A.M. Best, respectively) to
below Baa2/BBB/A-, or a downgrade in ALIC’s financial strength ratings from A1, A+ and A+ (from Moody’s, S&P
and A.M. Best, respectively) to below A3/A-/A-. The rating agencies also consider the interdependence of our
individually rated entities; therefore, a rating change in one entity could potentially affect the ratings of other related
entities.
82