Allstate 2013 Annual Report Download - page 156
Download and view the complete annual report
Please find page 156 of the 2013 Allstate annual report below. You can navigate through the pages in the report by either clicking on the pages listed below, or by using the keyword search tool below to find specific information within the annual report.-
 1
1 -
2
-
3
-
4
-
5
-
6
-
7
-
8
-
9
-
10
-
11
-
12
-
13
-
14
-
15
-
16
-
17
-
18
-
19
-
20
-
21
-
22
-
23
-
24
-
25
-
26
-
27
-
28
-
29
-
30
-
31
-
32
-
33
-
34
-
35
-
36
-
37
-
38
-
39
-
40
-
41
-
42
-
43
-
44
-
45
-
46
-
47
-
48
-
49
-
50
-
51
-
52
-
53
-
54
-
55
-
56
-
57
-
58
-
59
-
60
-
61
-
62
-
63
-
64
-
65
-
66
-
67
-
68
-
69
-
70
-
71
-
72
-
73
-
74
-
75
-
76
-
77
-
78
-
79
-
80
-
81
-
82
-
83
-
84
-
85
-
86
-
87
-
88
-
89
-
90
-
91
-
92
-
93
-
94
-
95
-
96
-
97
-
98
-
99
-
100
-
101
-
102
-
103
-
104
-
105
-
106
-
107
-
108
-
109
-
110
-
111
-
112
-
113
-
114
-
115
-
116
-
117
-
118
-
119
-
120
-
121
-
122
-
123
-
124
-
125
-
126
-
127
-
128
-
129
-
130
-
131
-
132
-
133
-
134
-
135
-
136
-
137
-
138
-
139
-
140
-
141
-
142
-
143
-
144
-
145
-
 146
146 -
 147
147 -
 148
148 -
 149
149 -
 150
150 -
 151
151 -
 152
152 -
 153
153 -
 154
154 -
 155
155 -
 156
156 -
 157
157 -
 158
158 -
 159
159 -
 160
160 -
 161
161 -
 162
162 -
 163
163 -
 164
164 -
 165
165 -
 166
166 -
167
-
168
-
169
-
170
-
171
-
172
-
173
-
174
-
175
-
176
-
177
-
178
-
179
-
180
-
181
-
182
-
183
-
184
-
185
-
186
-
187
-
188
-
189
-
190
-
191
-
192
-
193
-
194
-
195
-
196
-
197
-
198
-
199
-
200
-
201
-
202
-
203
-
204
-
205
-
206
-
207
-
208
-
209
-
210
-
211
-
212
-
213
-
214
-
215
-
216
-
217
-
218
-
219
-
220
-
221
-
222
-
223
-
224
-
225
-
226
-
227
-
228
-
229
-
230
-
231
-
232
-
233
-
234
-
235
-
236
-
237
-
238
-
239
-
240
-
241
-
242
-
243
-
244
-
245
-
246
-
247
-
248
-
249
-
250
-
251
-
252
-
253
-
254
-
255
-
256
-
257
-
258
-
259
-
260
-
261
-
262
-
263
-
264
-
265
-
266
-
267
-
268
-
269
-
270
-
271
-
272
-
273
-
274
-
275
-
276
-
277
-
278
-
279
-
280
-
281
-
282
-
283
-
284
-
285
-
286
-
287
-
288
-
289
-
290
-
291
-
292
-
293
-
294
-
295
-
296
 |
 |

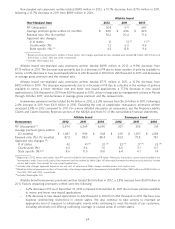
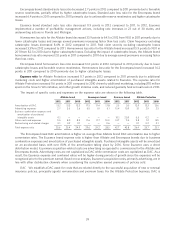
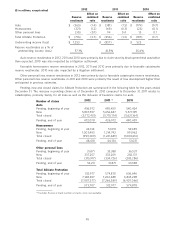
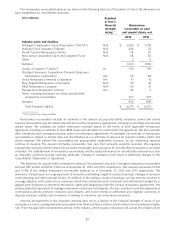
amortized to income over the period in which premiums are earned. The DAC balance as of December 31 by brand and
product type are shown in the following table.
Allstate brand Encompass brand Esurance brand Allstate Protection
($ in millions)
2012 2011 2012 2011 2012 2011 2012 2011
Standard auto $ 508 $ 506 $ 54 $ 50 $ 7 $ 25 (1) $ 569 $ 581
Non-standard auto 23 25 ————2325
Homeowners 436 422 36 34 — — 472 456
Other personal lines 325 280 7 6 — — 332 286
Total DAC $ 1,292 $ 1,233 $ 97 $ 90 $ 7 $ 25 $ 1,396 $ 1,348
(1) Includes $21 million of present value of future profits, which was fully amortized in the first quarter of 2012.
Catastrophe management
Historical catastrophe experience For the last ten years, the average annual impact of catastrophes on our Property-
Liability loss ratio was 9.7 points. The average annual impact of catastrophes on the homeowners loss ratio for the last
ten years was 32.4 points.
Over time, we have limited our aggregate insurance exposure to catastrophe losses in certain regions of the country
that are subject to high levels of natural catastrophes. Limitations include our participation in various state facilities,
such as the California Earthquake Authority (‘‘CEA’’), which provides insurance for California earthquake losses; the
Florida Hurricane Catastrophe Fund (‘‘FHCF’’), which provides reimbursements to participating insurers for certain
qualifying Florida hurricane losses; and other state facilities, such as wind pools. However, the impact of these actions
may be diminished by the growth in insured values, and the effect of state insurance laws and regulations. In addition, in
various states we are required to participate in assigned risk plans, reinsurance facilities and joint underwriting
associations that provide insurance coverage to individuals or entities that otherwise are unable to purchase such
coverage from private insurers. Because of our participation in these and other state facilities such as wind pools, we
may be exposed to losses that surpass the capitalization of these facilities and to assessments from these facilities.
We have continued to take actions to maintain an appropriate level of exposure to catastrophic events while
continuing to meet the needs of our customers, including the following:
• Selectively not offering continuing coverage of homeowners policies in coastal areas of certain states. This
includes New York and New Jersey where our homeowners PIF decreased 29.4% and 32.6%, respectively,
since 2006.
• Increased capacity in our brokerage platform for customers not offered a renewal.
• North Light expanded to 5 new states in 2012, bringing the total number of active states to 31.
• In Texas we have been ceding wind exposure related to insured property located in wind pool eligible areas
along the coast including the Galveston Islands.
• We ceased writing new homeowners business in California in 2007. We continue to renew current
policyholders.
• We ceased writing new homeowners business in Florida in 2011 beyond a modest stance for existing customers
who replace their currently-insured home with an acceptable property. The Encompass companies operating in
Florida withdrew from the property lines in 2009.
• Tropical cyclone deductibles are in place for a large portion of coastal insured properties though contract
language varies across states and companies, allowing for these higher deductibles to be triggered differently
across our customer base.
• We have additional catastrophe exposure, beyond the property lines, for auto customers who have purchased
physical damage coverage. Auto physical damage coverage generally includes coverage for flood-related loss.
We manage this additional exposure through inclusion of auto losses in our nationwide reinsurance program
(which excludes New Jersey and Florida).
Hurricanes
We consider the greatest areas of potential catastrophe losses due to hurricanes generally to be major metropolitan
centers in counties along the eastern and gulf coasts of the United States. Usually, the average premium on a property
policy near these coasts is greater than in other areas. However, average premiums are often not considered
commensurate with the inherent risk of loss. In addition and as explained in Note 14 of the consolidated financial
statements, in various states Allstate is subject to assessments from assigned risk plans, reinsurance facilities and joint
underwriting associations providing insurance for wind related property losses.
40