Allstate 2013 Annual Report Download - page 178
Download and view the complete annual report
Please find page 178 of the 2013 Allstate annual report below. You can navigate through the pages in the report by either clicking on the pages listed below, or by using the keyword search tool below to find specific information within the annual report.-
 1
1 -
2
-
3
-
4
-
5
-
6
-
7
-
8
-
9
-
10
-
11
-
12
-
13
-
14
-
15
-
16
-
17
-
18
-
19
-
20
-
21
-
22
-
23
-
24
-
25
-
26
-
27
-
28
-
29
-
30
-
31
-
32
-
33
-
34
-
35
-
36
-
37
-
38
-
39
-
40
-
41
-
42
-
43
-
44
-
45
-
46
-
47
-
48
-
49
-
50
-
51
-
52
-
53
-
54
-
55
-
56
-
57
-
58
-
59
-
60
-
61
-
62
-
63
-
64
-
65
-
66
-
67
-
68
-
69
-
70
-
71
-
72
-
73
-
74
-
75
-
76
-
77
-
78
-
79
-
80
-
81
-
82
-
83
-
84
-
85
-
86
-
87
-
88
-
89
-
90
-
91
-
92
-
93
-
94
-
95
-
96
-
97
-
98
-
99
-
100
-
101
-
102
-
103
-
104
-
105
-
106
-
107
-
108
-
109
-
110
-
111
-
112
-
113
-
114
-
115
-
116
-
117
-
118
-
119
-
120
-
121
-
122
-
123
-
124
-
125
-
126
-
127
-
128
-
129
-
130
-
131
-
132
-
133
-
134
-
135
-
136
-
137
-
138
-
139
-
140
-
141
-
142
-
143
-
144
-
145
-
146
-
147
-
148
-
149
-
150
-
151
-
152
-
153
-
154
-
155
-
156
-
157
-
158
-
159
-
160
-
161
-
162
-
163
-
164
-
165
-
166
-
167
-
 168
168 -
 169
169 -
 170
170 -
 171
171 -
 172
172 -
 173
173 -
 174
174 -
 175
175 -
 176
176 -
 177
177 -
 178
178 -
 179
179 -
 180
180 -
 181
181 -
 182
182 -
 183
183 -
 184
184 -
 185
185 -
 186
186 -
 187
187 -
 188
188 -
189
-
190
-
191
-
192
-
193
-
194
-
195
-
196
-
197
-
198
-
199
-
200
-
201
-
202
-
203
-
204
-
205
-
206
-
207
-
208
-
209
-
210
-
211
-
212
-
213
-
214
-
215
-
216
-
217
-
218
-
219
-
220
-
221
-
222
-
223
-
224
-
225
-
226
-
227
-
228
-
229
-
230
-
231
-
232
-
233
-
234
-
235
-
236
-
237
-
238
-
239
-
240
-
241
-
242
-
243
-
244
-
245
-
246
-
247
-
248
-
249
-
250
-
251
-
252
-
253
-
254
-
255
-
256
-
257
-
258
-
259
-
260
-
261
-
262
-
263
-
264
-
265
-
266
-
267
-
268
-
269
-
270
-
271
-
272
-
273
-
274
-
275
-
276
-
277
-
278
-
279
-
280
-
281
-
282
-
283
-
284
-
285
-
286
-
287
-
288
-
289
-
290
-
291
-
292
-
293
-
294
-
295
-
296
 |
 |

duration, liquidity and capital considerations. Within the ranges set by the strategic asset allocation, tactical investment
decisions are made in consideration of prevailing market conditions. We manage risks associated with interest rates,
credit spreads, equity markets, real estate and currency exchange rates. Our continuing focus is to manage risks and
returns and to position our portfolio to take advantage of market opportunities while attempting to mitigate adverse
effects.
The Property-Liability portfolio’s investment strategy emphasizes protection of principal and consistent income
generation, within a total return framework. This approach, which has produced competitive returns over the long term,
is designed to ensure financial strength and stability for paying claims, while maximizing economic value and surplus
growth.
The Allstate Financial portfolio’s investment strategy focuses on the total return of assets needed to support the
underlying liabilities, asset-liability management and achieving an appropriate return on capital.
The Corporate and Other portfolio’s investment strategy balances the unique liquidity needs of the portfolio in
relation to the overall corporate capital structure with the pursuit of returns.
Investments outlook
We anticipate that interest rates may remain below historic averages for an extended period of time and that
financial markets will continue to have periods of high volatility. Invested assets and income are expected to decline in
line with reductions in contractholder funds for the Allstate Financial segment and as we continue to invest and reinvest
proceeds at market yields that are below the current portfolio yield. We plan to focus on the following priorities:
• Optimizing return and risk in an uncertain economic climate and volatile investment markets.
• Reducing our exposure to interest rate risk by targeting a shorter maturity profile in the Property-Liability
portfolio.
• Shifting the portfolio mix in the next few years to have less reliance on lending to borrowers and a greater
proportion of ownership of assets including real estate and other cash-generating assets.
• Managing the alignment of assets with respect to Allstate Financial’s changing liability profile.
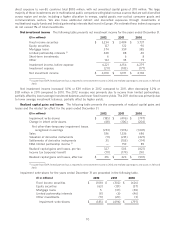
Portfolio composition The composition of the investment portfolios as of December 31, 2012 is presented in the
table below.
Corporate and($ in millions)
Property-Liability (5) Allstate Financial (5) Other (5) Total
Percent Percent Percent Percent
to total to total to total to total
Fixed income securities (1) $ 29,681 77.7% $ 45,796 80.3% $ 1,540 74.6% $ 77,017 79.2%
Equity securities (2) 3,671 9.6 366 0.6 — — 4,037 4.1
Mortgage loans 493 1.3 6,077 10.7 — — 6,570 6.8
Limited partnership
interests (3) 2,991 7.8 1,924 3.4 7 0.3 4,922 5.1
Short-term (4) 912 2.4 907 1.6 517 25.1 2,336 2.4
Other 467 1.2 1,929 3.4 — — 2,396 2.4
Total $ 38,215 100.0% $ 56,999 100.0% $ 2,064 100.0% $ 97,278 100.0%
(1) Fixed income securities are carried at fair value. Amortized cost basis for these securities was $28.37 billion, $42.05 billion and $1.50 billion for
Property-Liability, Allstate Financial and Corporate and Other, respectively.
(2) Equity securities are carried at fair value. Cost basis for these securities was $3.25 billion and $327 million for Property-Liability and Allstate
Financial, respectively.
(3) We have commitments to invest in additional limited partnership interests totaling $1.13 billion and $947 million for Property-Liability and Allstate
Financial, respectively.
(4) Short-term investments are carried at fair value. Amortized cost basis for these investments was $912 million, $907 million and $517 million for
Property-Liability, Allstate Financial and Corporate and Other, respectively.
(5) Balances reflect the elimination of related party investments between segments.
Total investments increased to $97.28 billion as of December 31, 2012, from $95.62 billion as of December 31, 2011,
primarily due to higher valuations of fixed income securities and positive Property-Liability operating cash flows,
partially offset by net reductions in Allstate Financial’s contractholder funds. Valuations of fixed income securities are
typically driven by a combination of changes in relevant risk-free interest rates and credit spreads over the period.
Risk-free interest rates are typically referenced as the yield on U.S. Treasury securities, whereas credit spread is the
additional yield on fixed income securities above the risk-free rate that market participants require to compensate them
62