Allstate 2013 Annual Report Download - page 236
Download and view the complete annual report
Please find page 236 of the 2013 Allstate annual report below. You can navigate through the pages in the report by either clicking on the pages listed below, or by using the keyword search tool below to find specific information within the annual report.-
 1
1 -
2
-
3
-
4
-
5
-
6
-
7
-
8
-
9
-
10
-
11
-
12
-
13
-
14
-
15
-
16
-
17
-
18
-
19
-
20
-
21
-
22
-
23
-
24
-
25
-
26
-
27
-
28
-
29
-
30
-
31
-
32
-
33
-
34
-
35
-
36
-
37
-
38
-
39
-
40
-
41
-
42
-
43
-
44
-
45
-
46
-
47
-
48
-
49
-
50
-
51
-
52
-
53
-
54
-
55
-
56
-
57
-
58
-
59
-
60
-
61
-
62
-
63
-
64
-
65
-
66
-
67
-
68
-
69
-
70
-
71
-
72
-
73
-
74
-
75
-
76
-
77
-
78
-
79
-
80
-
81
-
82
-
83
-
84
-
85
-
86
-
87
-
88
-
89
-
90
-
91
-
92
-
93
-
94
-
95
-
96
-
97
-
98
-
99
-
100
-
101
-
102
-
103
-
104
-
105
-
106
-
107
-
108
-
109
-
110
-
111
-
112
-
113
-
114
-
115
-
116
-
117
-
118
-
119
-
120
-
121
-
122
-
123
-
124
-
125
-
126
-
127
-
128
-
129
-
130
-
131
-
132
-
133
-
134
-
135
-
136
-
137
-
138
-
139
-
140
-
141
-
142
-
143
-
144
-
145
-
146
-
147
-
148
-
149
-
150
-
151
-
152
-
153
-
154
-
155
-
156
-
157
-
158
-
159
-
160
-
161
-
162
-
163
-
164
-
165
-
166
-
167
-
168
-
169
-
170
-
171
-
172
-
173
-
174
-
175
-
176
-
177
-
178
-
179
-
180
-
181
-
182
-
183
-
184
-
185
-
186
-
187
-
188
-
189
-
190
-
191
-
192
-
193
-
194
-
195
-
196
-
197
-
198
-
199
-
200
-
201
-
202
-
203
-
204
-
205
-
206
-
207
-
208
-
209
-
210
-
211
-
212
-
213
-
214
-
215
-
216
-
217
-
218
-
219
-
220
-
221
-
222
-
223
-
224
-
225
-
 226
226 -
 227
227 -
 228
228 -
 229
229 -
 230
230 -
 231
231 -
 232
232 -
 233
233 -
 234
234 -
 235
235 -
 236
236 -
 237
237 -
 238
238 -
 239
239 -
 240
240 -
 241
241 -
 242
242 -
 243
243 -
 244
244 -
 245
245 -
 246
246 -
247
-
248
-
249
-
250
-
251
-
252
-
253
-
254
-
255
-
256
-
257
-
258
-
259
-
260
-
261
-
262
-
263
-
264
-
265
-
266
-
267
-
268
-
269
-
270
-
271
-
272
-
273
-
274
-
275
-
276
-
277
-
278
-
279
-
280
-
281
-
282
-
283
-
284
-
285
-
286
-
287
-
288
-
289
-
290
-
291
-
292
-
293
-
294
-
295
-
296
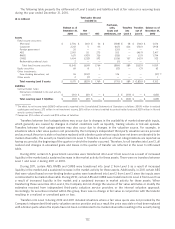
 |
 |

Balance as of
December 31,
Purchases Sales Issues Settlements 2012
Assets
Fixed income securities:
U.S. government and agencies $ — $ — $ — $ — $ 8
Municipal 46 (463) — (16) 965
Corporate 276 (310) — (137) 1,617
ABS 155 (217) — (33) 251
RMBS — — — (1) 3
CMBS 34 (27) — (15) 52
Redeemable preferred stock 1 (1) — — 1
Total fixed income securities 512 (1,018) — (202) 2,897
Equity securities 164 (38) — — 171
Other investments:
Free-standing derivatives, net 27 — — 14 (27) (2)
Other assets — — — — 1
Total recurring Level 3 assets $ 703 $ (1,056) $ — $ (188) $ 3,042
Liabilities
Contractholder funds:
Derivatives embedded in life and annuity
contracts $ — $ — $ (79) $ 81 $ (553)
Total recurring Level 3 liabilities $ — $ — $ (79) $ 81 $ (553)
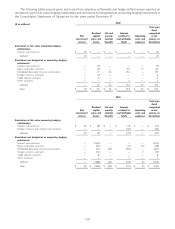
(1) The effect to net income totals $195 million and is reported in the Consolidated Statements of Operations as follows: $27 million in net investment
income, $132 million in interest credited to contractholder funds and $36 million in life and annuity contract benefits.
(2) Comprises $3 million of assets and $30 million of liabilities.
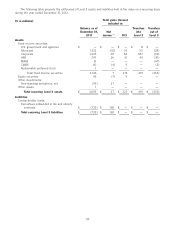
The following table presents the rollforward of Level 3 assets and liabilities held at fair value on a recurring basis
during the year ended December 31, 2011.
Total gains (losses)
($ in millions) included in:
Balance as of Transfers Transfers
December 31, Net into out of
2010 income (1) OCI Level 3 Level 3
Assets
Fixed income securities:
Municipal $ 2,016 $ (44) $ 54 $ 70 $ (82)
Corporate 1,908 62 (44) 239 (523)
ABS 2,417 23 (65) — (2,137)
RMBS 1,794 (86) 107 — (1,256)
CMBS 923 (43) 113 86 (966)
Redeemable preferred stock 1 — — — —
Total fixed income securities 9,059 (88) 165 395 (4,964)
Equity securities 63 (10) — — (10)
Other investments:
Free-standing derivatives, net (21) (91) — — —
Other assets 1 — — — —
Total recurring Level 3 assets $ 9,102 $ (189) $ 165 $ 395 $ (4,974)
Liabilities
Contractholder funds:
Derivatives embedded in life and annuity
contracts $ (653) $ (134) $ — $ — $ —
Total recurring Level 3 liabilities $ (653) $ (134) $ — $ — $ —
120