Allstate 2013 Annual Report Download - page 275
Download and view the complete annual report
Please find page 275 of the 2013 Allstate annual report below. You can navigate through the pages in the report by either clicking on the pages listed below, or by using the keyword search tool below to find specific information within the annual report.-
 1
1 -
2
-
3
-
4
-
5
-
6
-
7
-
8
-
9
-
10
-
11
-
12
-
13
-
14
-
15
-
16
-
17
-
18
-
19
-
20
-
21
-
22
-
23
-
24
-
25
-
26
-
27
-
28
-
29
-
30
-
31
-
32
-
33
-
34
-
35
-
36
-
37
-
38
-
39
-
40
-
41
-
42
-
43
-
44
-
45
-
46
-
47
-
48
-
49
-
50
-
51
-
52
-
53
-
54
-
55
-
56
-
57
-
58
-
59
-
60
-
61
-
62
-
63
-
64
-
65
-
66
-
67
-
68
-
69
-
70
-
71
-
72
-
73
-
74
-
75
-
76
-
77
-
78
-
79
-
80
-
81
-
82
-
83
-
84
-
85
-
86
-
87
-
88
-
89
-
90
-
91
-
92
-
93
-
94
-
95
-
96
-
97
-
98
-
99
-
100
-
101
-
102
-
103
-
104
-
105
-
106
-
107
-
108
-
109
-
110
-
111
-
112
-
113
-
114
-
115
-
116
-
117
-
118
-
119
-
120
-
121
-
122
-
123
-
124
-
125
-
126
-
127
-
128
-
129
-
130
-
131
-
132
-
133
-
134
-
135
-
136
-
137
-
138
-
139
-
140
-
141
-
142
-
143
-
144
-
145
-
146
-
147
-
148
-
149
-
150
-
151
-
152
-
153
-
154
-
155
-
156
-
157
-
158
-
159
-
160
-
161
-
162
-
163
-
164
-
165
-
166
-
167
-
168
-
169
-
170
-
171
-
172
-
173
-
174
-
175
-
176
-
177
-
178
-
179
-
180
-
181
-
182
-
183
-
184
-
185
-
186
-
187
-
188
-
189
-
190
-
191
-
192
-
193
-
194
-
195
-
196
-
197
-
198
-
199
-
200
-
201
-
202
-
203
-
204
-
205
-
206
-
207
-
208
-
209
-
210
-
211
-
212
-
213
-
214
-
215
-
216
-
217
-
218
-
219
-
220
-
221
-
222
-
223
-
224
-
225
-
226
-
227
-
228
-
229
-
230
-
231
-
232
-
233
-
234
-
235
-
236
-
237
-
238
-
239
-
240
-
241
-
242
-
243
-
244
-
245
-
246
-
247
-
248
-
249
-
250
-
251
-
252
-
253
-
254
-
255
-
256
-
257
-
258
-
259
-
260
-
261
-
262
-
263
-
264
-
 265
265 -
 266
266 -
 267
267 -
 268
268 -
 269
269 -
 270
270 -
 271
271 -
 272
272 -
 273
273 -
 274
274 -
 275
275 -
 276
276 -
 277
277 -
 278
278 -
 279
279 -
 280
280 -
 281
281 -
 282
282 -
 283
283 -
 284
284 -
 285
285 -
286
-
287
-
288
-
289
-
290
-
291
-
292
-
293
-
294
-
295
-
296
 |
 |

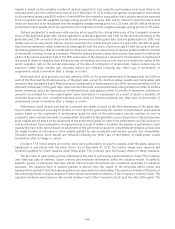
The PBO, ABO and fair value of plan assets for the Company’s pension plans with an ABO in excess of plan assets
were $6.35 billion, $5.75 billion and $5.02 billion, respectively, as of December 31, 2012 and $5.51 billion, $4.85 billion
and $4.33 billion, respectively, as of December 31, 2011. Included in the accrued benefit cost of the pension benefits are
certain unfunded non-qualified plans with accrued benefit costs of $146 million and $142 million for 2012 and 2011,
respectively.
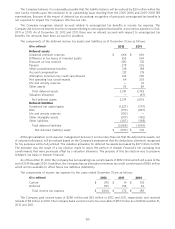
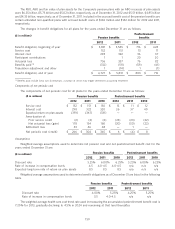
The changes in benefit obligations for all plans for the years ended December 31 are as follows:
Postretirement
($ in millions) Pension benefits benefits
2012 2011 2012 2011
Benefit obligation, beginning of year $ 5,831 $ 5,545 $ 716 $ 628
Service cost 152 151 13 11
Interest cost 298 322 36 37
Participant contributions 1 1 20 20
Actuarial loss 756 337 76 82
Benefits paid (1) (312) (511) (59) (61)
Translation adjustment and other 1 (14) 1 (1)
Benefit obligation, end of year $ 6,727 $ 5,831 $ 803 $ 716
(1) Benefits paid include lump sum distributions, a portion of which may trigger settlement accounting treatment.
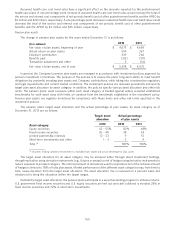
Components of net periodic cost
The components of net periodic cost for all plans for the years ended December 31 are as follows:
($ in millions) Pension benefits Postretirement benefits
2012 2011 2010 2012 2011 2010
Service cost $ 152 $ 151 $ 150 $ 13 $ 11 $ 12
Interest cost 298 322 320 36 37 40
Expected return on plan assets (393) (367) (331) — — —
Amortization of:
Prior service credit (2) (2) (2) (23) (23) (22)
Net actuarial loss (gain) 178 154 160 (20) (30) (22)
Settlement loss 33 46 48 — 1 —
Net periodic cost (credit) $ 266 $ 304 $ 345 $ 6 $ (4) $ 8
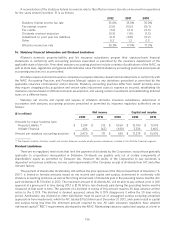
Assumptions
Weighted average assumptions used to determine net pension cost and net postretirement benefit cost for the
years ended December 31 are:
Pension benefits Postretirement benefits
($ in millions)
2012 2011 2010 2012 2011 2010
Discount rate 5.25% 6.00% 6.25% 5.25% 6.00% 6.25%
Rate of increase in compensation levels 4.5 4.0-4.5 4.0-4.5 n/a n/a n/a
Expected long-term rate of return on plan assets 8.5 8.5 8.5 n/a n/a n/a
Weighted average assumptions used to determine benefit obligations as of December 31 are listed in the following
table.
Pension benefits Postretirement benefits
2012 2011 2012 2011
Discount rate 4.00% 5.25% 4.25% 5.25%
Rate of increase in compensation levels 3.5 4.0-4.5 n/a n/a
The weighted average health care cost trend rate used in measuring the accumulated postretirement benefit cost is
7.20% for 2013, gradually declining to 4.5% in 2024 and remaining at that level thereafter.
159