Allstate 2013 Annual Report Download - page 184
Download and view the complete annual report
Please find page 184 of the 2013 Allstate annual report below. You can navigate through the pages in the report by either clicking on the pages listed below, or by using the keyword search tool below to find specific information within the annual report.-
 1
1 -
2
-
3
-
4
-
5
-
6
-
7
-
8
-
9
-
10
-
11
-
12
-
13
-
14
-
15
-
16
-
17
-
18
-
19
-
20
-
21
-
22
-
23
-
24
-
25
-
26
-
27
-
28
-
29
-
30
-
31
-
32
-
33
-
34
-
35
-
36
-
37
-
38
-
39
-
40
-
41
-
42
-
43
-
44
-
45
-
46
-
47
-
48
-
49
-
50
-
51
-
52
-
53
-
54
-
55
-
56
-
57
-
58
-
59
-
60
-
61
-
62
-
63
-
64
-
65
-
66
-
67
-
68
-
69
-
70
-
71
-
72
-
73
-
74
-
75
-
76
-
77
-
78
-
79
-
80
-
81
-
82
-
83
-
84
-
85
-
86
-
87
-
88
-
89
-
90
-
91
-
92
-
93
-
94
-
95
-
96
-
97
-
98
-
99
-
100
-
101
-
102
-
103
-
104
-
105
-
106
-
107
-
108
-
109
-
110
-
111
-
112
-
113
-
114
-
115
-
116
-
117
-
118
-
119
-
120
-
121
-
122
-
123
-
124
-
125
-
126
-
127
-
128
-
129
-
130
-
131
-
132
-
133
-
134
-
135
-
136
-
137
-
138
-
139
-
140
-
141
-
142
-
143
-
144
-
145
-
146
-
147
-
148
-
149
-
150
-
151
-
152
-
153
-
154
-
155
-
156
-
157
-
158
-
159
-
160
-
161
-
162
-
163
-
164
-
165
-
166
-
167
-
168
-
169
-
170
-
171
-
172
-
173
-
 174
174 -
 175
175 -
 176
176 -
 177
177 -
 178
178 -
 179
179 -
 180
180 -
 181
181 -
 182
182 -
 183
183 -
 184
184 -
 185
185 -
 186
186 -
 187
187 -
 188
188 -
 189
189 -
 190
190 -
 191
191 -
 192
192 -
 193
193 -
 194
194 -
195
-
196
-
197
-
198
-
199
-
200
-
201
-
202
-
203
-
204
-
205
-
206
-
207
-
208
-
209
-
210
-
211
-
212
-
213
-
214
-
215
-
216
-
217
-
218
-
219
-
220
-
221
-
222
-
223
-
224
-
225
-
226
-
227
-
228
-
229
-
230
-
231
-
232
-
233
-
234
-
235
-
236
-
237
-
238
-
239
-
240
-
241
-
242
-
243
-
244
-
245
-
246
-
247
-
248
-
249
-
250
-
251
-
252
-
253
-
254
-
255
-
256
-
257
-
258
-
259
-
260
-
261
-
262
-
263
-
264
-
265
-
266
-
267
-
268
-
269
-
270
-
271
-
272
-
273
-
274
-
275
-
276
-
277
-
278
-
279
-
280
-
281
-
282
-
283
-
284
-
285
-
286
-
287
-
288
-
289
-
290
-
291
-
292
-
293
-
294
-
295
-
296
 |
 |

risk-free interest rates. The increase for equity securities was primarily due to positive returns in the equity markets. The
following table presents unrealized net capital gains and losses as of December 31.
($ in millions) 2012 2011
U.S. government and agencies $ 326 $ 349
Municipal 930 607
Corporate 3,594 2,364
Foreign government 227 215
ABS 1 (214)
RMBS 32 (411)
CMBS (12) (178)
Redeemable preferred stock 4 2
Fixed income securities 5,102 2,734
Equity securities 460 160
EMA limited partnerships 7 2
Derivatives (22) (17)
Unrealized net capital gains and losses, pre-tax $ 5,547 $ 2,879
The unrealized net capital gains for the fixed income portfolio totaled $5.10 billion and comprised $5.63 billion of
gross unrealized gains and $530 million of gross unrealized losses as of December 31, 2012. This is compared to
unrealized net capital gains for the fixed income portfolio totaling $2.73 billion, comprised of $4.40 billion of gross
unrealized gains and $1.67 billion of gross unrealized losses as of December 31, 2011. Unrealized capital gains and losses
may decrease or increase as risk-free interest rates increase or decrease in the future.
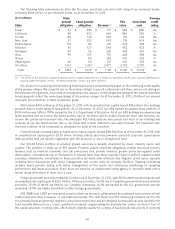
Gross unrealized gains and losses on fixed income securities by type and sector as of December 31, 2012 are
provided in the table below.
Gross unrealized
($ in millions) Amortized
cost Gains Losses Fair value
Corporate:
Banking $ 3,707 $ 195 $ (55) $ 3,847
Utilities 7,792 879 (17) 8,654
Capital goods 5,281 424 (15) 5,690
Financial services 3,436 257 (10) 3,683
Consumer goods (cyclical and non-cyclical) 9,960 758 (11) 10,707
Transportation 1,960 203 (8) 2,155
Technology 2,355 147 (4) 2,498
Basic industry 2,626 191 (3) 2,814
Energy 3,993 338 (1) 4,330
Communications 2,931 253 (1) 3,183
Other 902 76 (2) 976
Total corporate fixed income portfolio 44,943 3,721 (127) 48,537
U.S. government and agencies 4,387 326 — 4,713
Municipal 12,139 1,038 (108) 13,069
Foreign government 2,290 228 (1) 2,517
ABS 3,623 108 (107) 3,624
RMBS 3,000 142 (110) 3,032
CMBS 1,510 65 (77) 1,498
Redeemable preferred stock 23 4 — 27
Total fixed income securities $ 71,915 $ 5,632 $ (530) $ 77,017
The banking, utilities and capital goods sectors had the highest concentration of gross unrealized losses in our
corporate fixed income securities portfolio as of December 31, 2012. In general, credit spreads remain wider than at
initial purchase for most of the securities with gross unrealized losses in these categories.
68