Allstate 2013 Annual Report Download - page 171
Download and view the complete annual report
Please find page 171 of the 2013 Allstate annual report below. You can navigate through the pages in the report by either clicking on the pages listed below, or by using the keyword search tool below to find specific information within the annual report.-
 1
1 -
2
-
3
-
4
-
5
-
6
-
7
-
8
-
9
-
10
-
11
-
12
-
13
-
14
-
15
-
16
-
17
-
18
-
19
-
20
-
21
-
22
-
23
-
24
-
25
-
26
-
27
-
28
-
29
-
30
-
31
-
32
-
33
-
34
-
35
-
36
-
37
-
38
-
39
-
40
-
41
-
42
-
43
-
44
-
45
-
46
-
47
-
48
-
49
-
50
-
51
-
52
-
53
-
54
-
55
-
56
-
57
-
58
-
59
-
60
-
61
-
62
-
63
-
64
-
65
-
66
-
67
-
68
-
69
-
70
-
71
-
72
-
73
-
74
-
75
-
76
-
77
-
78
-
79
-
80
-
81
-
82
-
83
-
84
-
85
-
86
-
87
-
88
-
89
-
90
-
91
-
92
-
93
-
94
-
95
-
96
-
97
-
98
-
99
-
100
-
101
-
102
-
103
-
104
-
105
-
106
-
107
-
108
-
109
-
110
-
111
-
112
-
113
-
114
-
115
-
116
-
117
-
118
-
119
-
120
-
121
-
122
-
123
-
124
-
125
-
126
-
127
-
128
-
129
-
130
-
131
-
132
-
133
-
134
-
135
-
136
-
137
-
138
-
139
-
140
-
141
-
142
-
143
-
144
-
145
-
146
-
147
-
148
-
149
-
150
-
151
-
152
-
153
-
154
-
155
-
156
-
157
-
158
-
159
-
160
-
 161
161 -
 162
162 -
 163
163 -
 164
164 -
 165
165 -
 166
166 -
 167
167 -
 168
168 -
 169
169 -
 170
170 -
 171
171 -
 172
172 -
 173
173 -
 174
174 -
 175
175 -
 176
176 -
 177
177 -
 178
178 -
 179
179 -
 180
180 -
 181
181 -
182
-
183
-
184
-
185
-
186
-
187
-
188
-
189
-
190
-
191
-
192
-
193
-
194
-
195
-
196
-
197
-
198
-
199
-
200
-
201
-
202
-
203
-
204
-
205
-
206
-
207
-
208
-
209
-
210
-
211
-
212
-
213
-
214
-
215
-
216
-
217
-
218
-
219
-
220
-
221
-
222
-
223
-
224
-
225
-
226
-
227
-
228
-
229
-
230
-
231
-
232
-
233
-
234
-
235
-
236
-
237
-
238
-
239
-
240
-
241
-
242
-
243
-
244
-
245
-
246
-
247
-
248
-
249
-
250
-
251
-
252
-
253
-
254
-
255
-
256
-
257
-
258
-
259
-
260
-
261
-
262
-
263
-
264
-
265
-
266
-
267
-
268
-
269
-
270
-
271
-
272
-
273
-
274
-
275
-
276
-
277
-
278
-
279
-
280
-
281
-
282
-
283
-
284
-
285
-
286
-
287
-
288
-
289
-
290
-
291
-
292
-
293
-
294
-
295
-
296
 |
 |

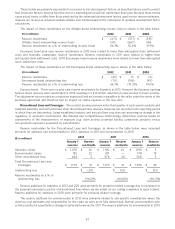
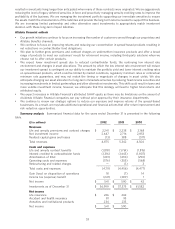
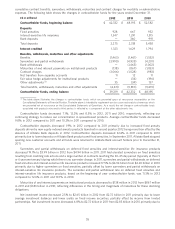
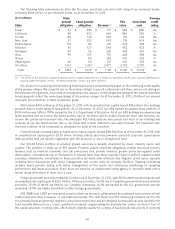
cumulative contract benefits, surrenders, withdrawals, maturities and contract charges for mortality or administrative
expenses. The following table shows the changes in contractholder funds for the years ended December 31.
($ in millions) 2012 2011 2010
Contractholder funds, beginning balance $ 42,332 $ 48,195 $ 52,582
Deposits
Fixed annuities 928 667 932
Interest-sensitive life insurance 1,347 1,291 1,515
Bank deposits — 360 991
Total deposits 2,275 2,318 3,438
Interest credited 1,323 1,629 1,794
Benefits, withdrawals, maturities and other adjustments
Benefits (1,463) (1,461) (1,552)
Surrenders and partial withdrawals (3,990) (4,935) (4,201)
Bank withdrawals — (1,463) (1,002)
Maturities of and interest payments on institutional products (138) (867) (1,833)
Contract charges (1,066) (1,028) (983)
Net transfers from separate accounts 11 12 11
Fair value hedge adjustments for institutional products — (34) (196)
Other adjustments (1) 35 (34) 137
Total benefits, withdrawals, maturities and other adjustments (6,611) (9,810) (9,619)
Contractholder funds, ending balance $ 39,319 $ 42,332 $ 48,195
(1) The table above illustrates the changes in contractholder funds, which are presented gross of reinsurance recoverables on the
Consolidated Statements of Financial Position. The table above is intended to supplement our discussion and analysis of revenues, which
are presented net of reinsurance on the Consolidated Statements of Operations. As a result, the net change in contractholder funds
associated with products reinsured to third parties is reflected as a component of the other adjustments line.
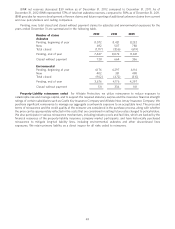
Contractholder funds decreased 7.1%, 12.2% and 8.3% in 2012, 2011 and 2010, respectively, reflecting our
continuing strategy to reduce our concentration in spread-based products. Average contractholder funds decreased
9.8% in 2012 compared to 2011 and 10.2% in 2011 compared to 2010.
Contractholder deposits decreased 1.9% in 2012 compared to 2011 primarily due to increased fixed annuity
deposits driven by new equity-indexed annuity products launched in second quarter 2012 being more than offset by the
absence of Allstate Bank deposits in 2012. Contractholder deposits decreased 32.6% in 2011 compared to 2010
primarily due to lower deposits on Allstate Bank products and fixed annuities. In September 2011, Allstate Bank stopped
opening new customer accounts and all funds were returned to Allstate Bank account holders prior to December 31,
2011.
Surrenders and partial withdrawals on deferred fixed annuities and interest-sensitive life insurance products
decreased 19.1% to $3.99 billion in 2012 from $4.94 billion in 2011. 2011 had elevated surrenders on fixed annuities
resulting from crediting rate actions and a large number of contracts reaching the 30-45 day period (typically at their 5
or 6 year anniversary) during which there is no surrender charge. In 2011, surrenders and partial withdrawals on deferred
fixed annuities and interest-sensitive life insurance products increased 17.5% to $4.94 billion from $4.20 billion in 2010
primarily due to higher surrenders on fixed annuities, partially offset by lower surrenders and partial withdrawals on
interest-sensitive life insurance products. The surrender and partial withdrawal rate on deferred fixed annuities and
interest-sensitive life insurance products, based on the beginning of year contractholder funds, was 11.3% in 2012
compared to 12.6% in 2011 and 10.1% in 2010.
Maturities of and interest payments on institutional products decreased to $138 million in 2012 from $867 million
in 2011 and $1.83 billion in 2010, reflecting differences in the timing and magnitude of maturities for these declining
obligations.
Net investment income decreased 2.5% to $2.65 billion in 2012 from $2.72 billion in 2011 primarily due to lower
average investment balances and lower yields on fixed income securities, partially offset by income from limited
partnerships. Net investment income decreased 4.8% to $2.72 billion in 2011 from $2.85 billion in 2010 primarily due to
55