Allstate 2013 Annual Report Download - page 169
Download and view the complete annual report
Please find page 169 of the 2013 Allstate annual report below. You can navigate through the pages in the report by either clicking on the pages listed below, or by using the keyword search tool below to find specific information within the annual report.-
 1
1 -
2
-
3
-
4
-
5
-
6
-
7
-
8
-
9
-
10
-
11
-
12
-
13
-
14
-
15
-
16
-
17
-
18
-
19
-
20
-
21
-
22
-
23
-
24
-
25
-
26
-
27
-
28
-
29
-
30
-
31
-
32
-
33
-
34
-
35
-
36
-
37
-
38
-
39
-
40
-
41
-
42
-
43
-
44
-
45
-
46
-
47
-
48
-
49
-
50
-
51
-
52
-
53
-
54
-
55
-
56
-
57
-
58
-
59
-
60
-
61
-
62
-
63
-
64
-
65
-
66
-
67
-
68
-
69
-
70
-
71
-
72
-
73
-
74
-
75
-
76
-
77
-
78
-
79
-
80
-
81
-
82
-
83
-
84
-
85
-
86
-
87
-
88
-
89
-
90
-
91
-
92
-
93
-
94
-
95
-
96
-
97
-
98
-
99
-
100
-
101
-
102
-
103
-
104
-
105
-
106
-
107
-
108
-
109
-
110
-
111
-
112
-
113
-
114
-
115
-
116
-
117
-
118
-
119
-
120
-
121
-
122
-
123
-
124
-
125
-
126
-
127
-
128
-
129
-
130
-
131
-
132
-
133
-
134
-
135
-
136
-
137
-
138
-
139
-
140
-
141
-
142
-
143
-
144
-
145
-
146
-
147
-
148
-
149
-
150
-
151
-
152
-
153
-
154
-
155
-
156
-
157
-
158
-
 159
159 -
 160
160 -
 161
161 -
 162
162 -
 163
163 -
 164
164 -
 165
165 -
 166
166 -
 167
167 -
 168
168 -
 169
169 -
 170
170 -
 171
171 -
 172
172 -
 173
173 -
 174
174 -
 175
175 -
 176
176 -
 177
177 -
 178
178 -
 179
179 -
180
-
181
-
182
-
183
-
184
-
185
-
186
-
187
-
188
-
189
-
190
-
191
-
192
-
193
-
194
-
195
-
196
-
197
-
198
-
199
-
200
-
201
-
202
-
203
-
204
-
205
-
206
-
207
-
208
-
209
-
210
-
211
-
212
-
213
-
214
-
215
-
216
-
217
-
218
-
219
-
220
-
221
-
222
-
223
-
224
-
225
-
226
-
227
-
228
-
229
-
230
-
231
-
232
-
233
-
234
-
235
-
236
-
237
-
238
-
239
-
240
-
241
-
242
-
243
-
244
-
245
-
246
-
247
-
248
-
249
-
250
-
251
-
252
-
253
-
254
-
255
-
256
-
257
-
258
-
259
-
260
-
261
-
262
-
263
-
264
-
265
-
266
-
267
-
268
-
269
-
270
-
271
-
272
-
273
-
274
-
275
-
276
-
277
-
278
-
279
-
280
-
281
-
282
-
283
-
284
-
285
-
286
-
287
-
288
-
289
-
290
-
291
-
292
-
293
-
294
-
295
-
296
 |
 |

resulted in annuitants living longer than anticipated when many of these contracts were originated. We are aggressively
reducing the level of legacy deferred annuities in force and proactively managing annuity crediting rates to improve the
profitability of the business. We are managing the investment portfolio supporting our immediate annuities to ensure
the assets match the characteristics of the liabilities and provide the long-term returns needed to support this business.
We are increasing limited partnership and other alternative asset investments to appropriately match investment
duration with these long-term illiquid liabilities.
Allstate Financial outlook
• Our growth initiatives continue to focus on increasing the number of customers served through our proprietary and
Allstate Benefits channels.
• We continue to focus on improving returns and reducing our concentration in spread-based products resulting in
net reductions in contractholder fund obligations.
• We plan to further grow premiums and contract charges on underwritten insurance products and offer a broad
range of products to meet our customers’ needs for retirement income, including third-party solutions when we
choose not to offer certain products.
• We expect lower investment spread due to reduced contractholder funds, the continuing low interest rate
environment and changes in asset allocations. The amount by which the low interest rate environment will reduce
our investment spread is contingent on our ability to maintain the portfolio yield and lower interest crediting rates
on spread-based products, which could be limited by market conditions, regulatory minimum rates or contractual
minimum rate guarantees, and may not match the timing or magnitude of changes in asset yields. We also
anticipate changing our asset allocation for long-term immediate annuities by reducing fixed income securities and
increasing investments in limited partnerships and other alternative investments. This shift could result in lower and
more volatile investment income; however, we anticipate that this strategy will lead to higher total returns and
attributed equity.
• We expect increases in Allstate Financial’s attributed GAAP equity as there may be limitations on the amount of
dividends Allstate Financial companies can pay without prior approval by their insurance departments.
• We continue to review our strategic options to reduce our exposure and improve returns of the spread-based
businesses. As a result, we may take additional operational and financial actions that offer return improvement and
risk reduction opportunities.
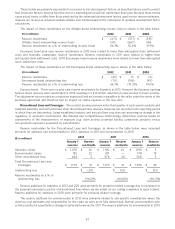
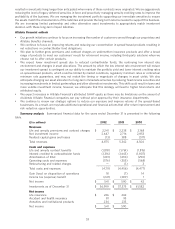
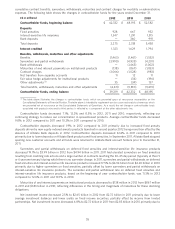
Summary analysis Summarized financial data for the years ended December 31 is presented in the following
table.
($ in millions) 2012 2011 2010
Revenues
Life and annuity premiums and contract charges $ 2,241 $ 2,238 $ 2,168
Net investment income 2,647 2,716 2,853
Realized capital gains and losses (13) 388 (517)
Total revenues 4,875 5,342 4,504
Costs and expenses
Life and annuity contract benefits (1,818) (1,761) (1,815)
Interest credited to contractholder funds (1,316) (1,645) (1,807)
Amortization of DAC (401) (494) (290)
Operating costs and expenses (576) (555) (568)
Restructuring and related charges — (1) 3
Total costs and expenses (4,111) (4,456) (4,477)
Gain (loss) on disposition of operations 18 (7) 14
Income tax (expense) benefit (241) (289) 1
Net income $ 541 $ 590 $ 42
Investments as of December 31 $ 56,999 $ 57,373 $ 61,582
Net income
Life insurance $ 226 $ 262
Accident and health insurance 81 95
Annuities and institutional products 234 233
Net income $ 541 $ 590
53