Allstate 2013 Annual Report Download - page 214
Download and view the complete annual report
Please find page 214 of the 2013 Allstate annual report below. You can navigate through the pages in the report by either clicking on the pages listed below, or by using the keyword search tool below to find specific information within the annual report.-
 1
1 -
2
-
3
-
4
-
5
-
6
-
7
-
8
-
9
-
10
-
11
-
12
-
13
-
14
-
15
-
16
-
17
-
18
-
19
-
20
-
21
-
22
-
23
-
24
-
25
-
26
-
27
-
28
-
29
-
30
-
31
-
32
-
33
-
34
-
35
-
36
-
37
-
38
-
39
-
40
-
41
-
42
-
43
-
44
-
45
-
46
-
47
-
48
-
49
-
50
-
51
-
52
-
53
-
54
-
55
-
56
-
57
-
58
-
59
-
60
-
61
-
62
-
63
-
64
-
65
-
66
-
67
-
68
-
69
-
70
-
71
-
72
-
73
-
74
-
75
-
76
-
77
-
78
-
79
-
80
-
81
-
82
-
83
-
84
-
85
-
86
-
87
-
88
-
89
-
90
-
91
-
92
-
93
-
94
-
95
-
96
-
97
-
98
-
99
-
100
-
101
-
102
-
103
-
104
-
105
-
106
-
107
-
108
-
109
-
110
-
111
-
112
-
113
-
114
-
115
-
116
-
117
-
118
-
119
-
120
-
121
-
122
-
123
-
124
-
125
-
126
-
127
-
128
-
129
-
130
-
131
-
132
-
133
-
134
-
135
-
136
-
137
-
138
-
139
-
140
-
141
-
142
-
143
-
144
-
145
-
146
-
147
-
148
-
149
-
150
-
151
-
152
-
153
-
154
-
155
-
156
-
157
-
158
-
159
-
160
-
161
-
162
-
163
-
164
-
165
-
166
-
167
-
168
-
169
-
170
-
171
-
172
-
173
-
174
-
175
-
176
-
177
-
178
-
179
-
180
-
181
-
182
-
183
-
184
-
185
-
186
-
187
-
188
-
189
-
190
-
191
-
192
-
193
-
194
-
195
-
196
-
197
-
198
-
199
-
200
-
201
-
202
-
203
-
 204
204 -
 205
205 -
 206
206 -
 207
207 -
 208
208 -
 209
209 -
 210
210 -
 211
211 -
 212
212 -
 213
213 -
 214
214 -
 215
215 -
 216
216 -
 217
217 -
 218
218 -
 219
219 -
 220
220 -
 221
221 -
 222
222 -
 223
223 -
 224
224 -
225
-
226
-
227
-
228
-
229
-
230
-
231
-
232
-
233
-
234
-
235
-
236
-
237
-
238
-
239
-
240
-
241
-
242
-
243
-
244
-
245
-
246
-
247
-
248
-
249
-
250
-
251
-
252
-
253
-
254
-
255
-
256
-
257
-
258
-
259
-
260
-
261
-
262
-
263
-
264
-
265
-
266
-
267
-
268
-
269
-
270
-
271
-
272
-
273
-
274
-
275
-
276
-
277
-
278
-
279
-
280
-
281
-
282
-
283
-
284
-
285
-
286
-
287
-
288
-
289
-
290
-
291
-
292
-
293
-
294
-
295
-
296
 |
 |
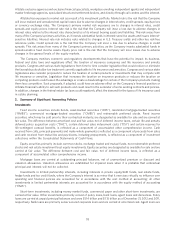
Customers of the Company may exchange one insurance policy or investment contract for another offered by the
Company, or make modifications to an existing investment, life or property-liability contract issued by the Company.
These transactions are identified as internal replacements for accounting purposes. Internal replacement transactions
determined to result in replacement contracts that are substantially unchanged from the replaced contracts are
accounted for as continuations of the replaced contracts. Unamortized DAC and DSI related to the replaced contracts
continue to be deferred and amortized in connection with the replacement contracts. For interest-sensitive life and
investment contracts, the EGP of the replacement contracts are treated as a revision to the EGP of the replaced
contracts in the determination of amortization of DAC and DSI. For traditional life and property-liability insurance
policies, any changes to unamortized DAC that result from replacement contracts are treated as prospective revisions.
Any costs associated with the issuance of replacement contracts are characterized as maintenance costs and expensed
as incurred. Internal replacement transactions determined to result in a substantial change to the replaced contracts are
accounted for as an extinguishment of the replaced contracts, and any unamortized DAC and DSI related to the replaced
contracts are eliminated with a corresponding charge to amortization of deferred policy acquisition costs or interest
credited to contractholder funds, respectively.
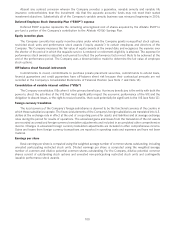
The costs assigned to the right to receive future cash flows from certain business purchased from other insurers are
also classified as DAC in the Consolidated Statements of Financial Position. The costs capitalized represent the present
value of future profits expected to be earned over the lives of the contracts acquired. These costs are amortized as
profits emerge over the lives of the acquired business and are periodically evaluated for recoverability. The present value
of future profits was $95 million and $136 million as of December 31, 2012 and 2011, respectively. Amortization expense
of the present value of future profits was $41 million, $39 million and $23 million in 2012, 2011 and 2010, respectively.
Reinsurance
In the normal course of business, the Company seeks to limit aggregate and single exposure to losses on large risks
by purchasing reinsurance. The Company has also used reinsurance to effect the acquisition or disposition of certain
blocks of business. The amounts reported as reinsurance recoverables include amounts billed to reinsurers on losses
paid as well as estimates of amounts expected to be recovered from reinsurers on insurance liabilities and
contractholder funds that have not yet been paid. Reinsurance recoverables on unpaid losses are estimated based upon
assumptions consistent with those used in establishing the liabilities related to the underlying reinsured contracts.
Insurance liabilities are reported gross of reinsurance recoverables. Reinsurance premiums are generally reflected in
income in a manner consistent with the recognition of premiums on the reinsured contracts. For catastrophe coverage,
the cost of reinsurance premiums is recognized ratably over the contract period to the extent coverage remains
available. Reinsurance does not extinguish the Company’s primary liability under the policies written. Therefore, the
Company regularly evaluates the financial condition of its reinsurers, including their activities with respect to claim
settlement practices and commutations, and establishes allowances for uncollectible reinsurance as appropriate.
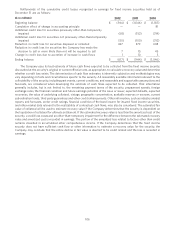
Goodwill
Goodwill represents the excess of amounts paid for acquiring businesses over the fair value of the net assets
acquired. The goodwill balances were $822 million and $418 million as of December 31, 2012 and $824 million and
$418 million as of December 31, 2011 for the Allstate Protection segment and the Allstate Financial segment,
respectively. The Company’s reporting units are equivalent to its reporting segments, Allstate Protection and Allstate
Financial. Goodwill is allocated to reporting units based on which unit is expected to benefit from the synergies of the
business combination. Goodwill is not amortized but is tested for impairment at least annually. The Company performs
its annual goodwill impairment testing during the fourth quarter of each year based upon data as of the close of the third
quarter. The Company also reviews goodwill for impairment whenever events or changes in circumstances, such as
deteriorating or adverse market conditions, indicate that it is more likely than not that the carrying amount of goodwill
may exceed its implied fair value.
To estimate the fair value of its reporting units, the Company may utilize a combination of widely accepted valuation
techniques including a stock price and market capitalization analysis, discounted cash flow calculations and peer
company price to earnings multiples analysis. The stock price and market capitalization analysis takes into
consideration the quoted market price of the Company’s outstanding common stock and includes a control premium,
derived from historical insurance industry acquisition activity, in determining the estimated fair value of the
consolidated entity before allocating that fair value to individual reporting units. The discounted cash flow analysis
utilizes long term assumptions for revenue growth, capital growth, earnings projections including those used in the
Company’s strategic plan, and an appropriate discount rate. The peer company price to earnings multiples analysis
takes into consideration the price to earnings multiples of peer companies for each reporting unit and estimated income
from the Company’s strategic plan.
98