Allstate 2013 Annual Report Download - page 127
Download and view the complete annual report
Please find page 127 of the 2013 Allstate annual report below. You can navigate through the pages in the report by either clicking on the pages listed below, or by using the keyword search tool below to find specific information within the annual report.-
 1
1 -
2
-
3
-
4
-
5
-
6
-
7
-
8
-
9
-
10
-
11
-
12
-
13
-
14
-
15
-
16
-
17
-
18
-
19
-
20
-
21
-
22
-
23
-
24
-
25
-
26
-
27
-
28
-
29
-
30
-
31
-
32
-
33
-
34
-
35
-
36
-
37
-
38
-
39
-
40
-
41
-
42
-
43
-
44
-
45
-
46
-
47
-
48
-
49
-
50
-
51
-
52
-
53
-
54
-
55
-
56
-
57
-
58
-
59
-
60
-
61
-
62
-
63
-
64
-
65
-
66
-
67
-
68
-
69
-
70
-
71
-
72
-
73
-
74
-
75
-
76
-
77
-
78
-
79
-
80
-
81
-
82
-
83
-
84
-
85
-
86
-
87
-
88
-
89
-
90
-
91
-
92
-
93
-
94
-
95
-
96
-
97
-
98
-
99
-
100
-
101
-
102
-
103
-
104
-
105
-
106
-
107
-
108
-
109
-
110
-
111
-
112
-
113
-
114
-
115
-
116
-
 117
117 -
 118
118 -
 119
119 -
 120
120 -
 121
121 -
 122
122 -
 123
123 -
 124
124 -
 125
125 -
 126
126 -
 127
127 -
 128
128 -
 129
129 -
 130
130 -
 131
131 -
 132
132 -
 133
133 -
 134
134 -
 135
135 -
 136
136 -
 137
137 -
138
-
139
-
140
-
141
-
142
-
143
-
144
-
145
-
146
-
147
-
148
-
149
-
150
-
151
-
152
-
153
-
154
-
155
-
156
-
157
-
158
-
159
-
160
-
161
-
162
-
163
-
164
-
165
-
166
-
167
-
168
-
169
-
170
-
171
-
172
-
173
-
174
-
175
-
176
-
177
-
178
-
179
-
180
-
181
-
182
-
183
-
184
-
185
-
186
-
187
-
188
-
189
-
190
-
191
-
192
-
193
-
194
-
195
-
196
-
197
-
198
-
199
-
200
-
201
-
202
-
203
-
204
-
205
-
206
-
207
-
208
-
209
-
210
-
211
-
212
-
213
-
214
-
215
-
216
-
217
-
218
-
219
-
220
-
221
-
222
-
223
-
224
-
225
-
226
-
227
-
228
-
229
-
230
-
231
-
232
-
233
-
234
-
235
-
236
-
237
-
238
-
239
-
240
-
241
-
242
-
243
-
244
-
245
-
246
-
247
-
248
-
249
-
250
-
251
-
252
-
253
-
254
-
255
-
256
-
257
-
258
-
259
-
260
-
261
-
262
-
263
-
264
-
265
-
266
-
267
-
268
-
269
-
270
-
271
-
272
-
273
-
274
-
275
-
276
-
277
-
278
-
279
-
280
-
281
-
282
-
283
-
284
-
285
-
286
-
287
-
288
-
289
-
290
-
291
-
292
-
293
-
294
-
295
-
296
 |
 |

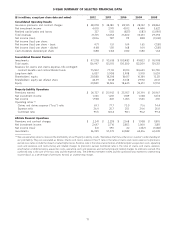
5-YEAR SUMMARY OF SELECTED FINANCIAL DATA
($ in millions, except per share data and ratios) 2012 2011 2010 2009 2008
Consolidated Operating Results
Insurance premiums and contract charges $ 28,978 $ 28,180 $ 28,125 $ 28,152 $ 28,862
Net investment income 4,010 3,971 4,102 4,444 5,622
Realized capital gains and losses 327 503 (827) (583) (5,090)
Total revenues 33,315 32,654 31,400 32,013 29,394
Net income (loss) 2,306 787 911 888 (1,542)
Net income (loss) per share:
Net income (loss) per share – basic 4.71 1.51 1.69 1.65 (2.81)
Net income (loss) per share – diluted 4.68 1.50 1.68 1.64 (2.81)
Cash dividends declared per share 0.88 0.84 0.80 0.80 1.64
Consolidated Financial Position
Investments $ 97,278 $ 95,618 $ 100,483 $ 99,833 $ 95,998
Total assets 126,947 125,193 130,500 132,209 134,351
Reserves for claims and claims expense, life-contingent
contract benefits and contractholder funds 75,502 77,113 81,113 84,659 90,750
Long-term debt 6,057 5,908 5,908 5,910 5,659
Shareholders’ equity 20,580 18,298 18,617 16,184 12,121
Shareholders’ equity per diluted share 42.39 36.18 34.58 29.90 22.51
Equity 20,580 18,326 18,645 16,213 12,153
Property-Liability Operations
Premiums earned $ 26,737 $ 25,942 $ 25,957 $ 26,194 $ 26,967
Net investment income 1,326 1,201 1,189 1,328 1,674
Net income 1,968 403 1,053 1,546 230
Operating ratios (1)
Claims and claims expense (‘‘loss’’) ratio 69.1 77.7 73.0 71.6 74.4
Expense ratio 26.4 25.7 25.1 24.6 25.0
Combined ratio 95.5 103.4 98.1 96.2 99.4
Allstate Financial Operations
Premiums and contract charges $ 2,241 $ 2,238 $ 2,168 $ 1,958 $ 1,895
Net investment income 2,647 2,716 2,853 3,064 3,811
Net income (loss) 541 590 42 (452) (1,586)
Investments 56,999 57,373 61,582 62,216 61,449
(1) We use operating ratios to measure the profitability of our Property-Liability results. We believe that they enhance an investor’s understanding of
our profitability. They are calculated as follows: Claims and claims expense (‘‘loss’’) ratio is the ratio of claims and claims expense to premiums
earned. Loss ratios include the impact of catastrophe losses. Expense ratio is the ratio of amortization of deferred policy acquisition costs, operating
costs and expenses and restructuring and related charges to premiums earned. Combined ratio is the ratio of claims and claims expense,
amortization of deferred policy acquisition costs, operating costs and expenses and restructuring and related charges to premiums earned. The
combined ratio is the sum of the loss ratio and the expense ratio. The difference between 100% and the combined ratio represents underwriting
income (loss) as a percentage of premiums earned, or underwriting margin.
11