Allstate 2013 Annual Report Download - page 52
Download and view the complete annual report
Please find page 52 of the 2013 Allstate annual report below. You can navigate through the pages in the report by either clicking on the pages listed below, or by using the keyword search tool below to find specific information within the annual report.-
 1
1 -
2
-
3
-
4
-
5
-
6
-
7
-
8
-
9
-
10
-
11
-
12
-
13
-
14
-
15
-
16
-
17
-
18
-
19
-
20
-
21
-
22
-
23
-
24
-
25
-
26
-
27
-
28
-
29
-
30
-
31
-
32
-
33
-
34
-
35
-
36
-
37
-
38
-
39
-
40
-
41
-
 42
42 -
 43
43 -
 44
44 -
 45
45 -
 46
46 -
 47
47 -
 48
48 -
 49
49 -
 50
50 -
 51
51 -
 52
52 -
 53
53 -
 54
54 -
 55
55 -
 56
56 -
 57
57 -
 58
58 -
 59
59 -
 60
60 -
 61
61 -
 62
62 -
63
-
64
-
65
-
66
-
67
-
68
-
69
-
70
-
71
-
72
-
73
-
74
-
75
-
76
-
77
-
78
-
79
-
80
-
81
-
82
-
83
-
84
-
85
-
86
-
87
-
88
-
89
-
90
-
91
-
92
-
93
-
94
-
95
-
96
-
97
-
98
-
99
-
100
-
101
-
102
-
103
-
104
-
105
-
106
-
107
-
108
-
109
-
110
-
111
-
112
-
113
-
114
-
115
-
116
-
117
-
118
-
119
-
120
-
121
-
122
-
123
-
124
-
125
-
126
-
127
-
128
-
129
-
130
-
131
-
132
-
133
-
134
-
135
-
136
-
137
-
138
-
139
-
140
-
141
-
142
-
143
-
144
-
145
-
146
-
147
-
148
-
149
-
150
-
151
-
152
-
153
-
154
-
155
-
156
-
157
-
158
-
159
-
160
-
161
-
162
-
163
-
164
-
165
-
166
-
167
-
168
-
169
-
170
-
171
-
172
-
173
-
174
-
175
-
176
-
177
-
178
-
179
-
180
-
181
-
182
-
183
-
184
-
185
-
186
-
187
-
188
-
189
-
190
-
191
-
192
-
193
-
194
-
195
-
196
-
197
-
198
-
199
-
200
-
201
-
202
-
203
-
204
-
205
-
206
-
207
-
208
-
209
-
210
-
211
-
212
-
213
-
214
-
215
-
216
-
217
-
218
-
219
-
220
-
221
-
222
-
223
-
224
-
225
-
226
-
227
-
228
-
229
-
230
-
231
-
232
-
233
-
234
-
235
-
236
-
237
-
238
-
239
-
240
-
241
-
242
-
243
-
244
-
245
-
246
-
247
-
248
-
249
-
250
-
251
-
252
-
253
-
254
-
255
-
256
-
257
-
258
-
259
-
260
-
261
-
262
-
263
-
264
-
265
-
266
-
267
-
268
-
269
-
270
-
271
-
272
-
273
-
274
-
275
-
276
-
277
-
278
-
279
-
280
-
281
-
282
-
283
-
284
-
285
-
286
-
287
-
288
-
289
-
290
-
291
-
292
-
293
-
294
-
295
-
296
 |
 |

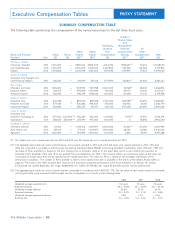
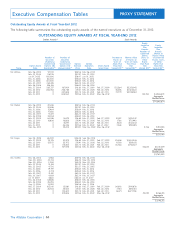
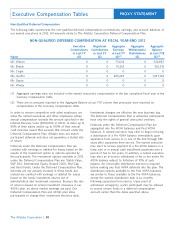
SUMMARY COMPENSATION TABLE
The following table summarizes the compensation of the named executives for the last three fiscal years.
(Chairman, President 2012 1,100,000 — 3,850,014 3,850,000 6,164,730 1,982,607(6) 111,204 17,058,555
and Chief Executive 2011 1,100,000 — 2,310,005 4,290,001 2,252,800 1,157,562 69,448 11,179,816
Officer) 2010 1,093,846 — 2,225,995 4,134,002 1,091,096 679,359 75,322 9,299,620
(Executive Vice President and
Chief Financial Officer) 2012 545,330 — 531,099 531,108 1,175,994 563,812(7) 33,904 3,381,247
(President and Chief 2012 690,000 — 949,995 949,998 2,000,000 48,581(8) 28,302 4,666,876
Executive Officer 2011 624,231 — 594,998 1,104,996 750,000 29,270 23,532 3,127,027
Allstate Financial) 2010 562,692 — 596,759 1,108,246 400,000 20,648 27,013 2,715,358
(Executive Vice 2012 606,538 — 899,992 899,998 1,700,000 952,989(9) 25,450 5,084,967
President and Chief 2011 577,692 — 535,486 994,500 750,000 616,936 32,156 3,506,770
Investment Officer) 2010 502,684 — 485,567 901,771 230,526 397,608 30,890 2,549,046
(Executive Vice
President—Technology & 2012 537,404 400,000(10) 656,239 656,250 1,209,822 11,519(11) 72,944 3,544,178
Operations) 2011 383,654 350,000(10) 674,991 975,004 500,000 0 18,896 2,902,545
(President, Allstate 2012 721,154 — 1,250,013 1,249,997 3,000,000 52,425(12) 37,400 6,310,989
Auto, Home, and 2011 654,231 — 770,012 1,429,997 1,000,000 48,100 44,180 3,946,520
Agencies) 2010 600,000 — 734,994 1,365,002 1,212,300 3,833 35,159 3,951,288
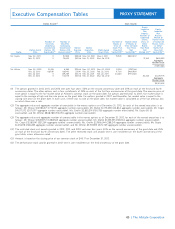
(1) Mr. Shebik was not a named executive for 2010 and 2011 and Mr. Gupta was not a named executive for 2010.
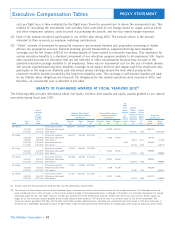
(2) The aggregate grant date fair value of performance stock awards granted in 2012 and restricted stock units awards granted in 2012, 2011, and
2010 are computed in accordance with Financial Accounting Standards Board (FASB) Accounting Standards Codification Topic 718 (ASC 718). The
fair value of PSAs and RSUs is based on the final closing price of Allstate’s stock as of the grant date, which in part reflects the payment of
expected future dividends. (See note 18 to our audited financial statements for 2012.) This amount reflects an accounting expense and does not
correspond to actual value that will be realized by the named executives. The value for PSAs is based on the probable satisfaction of the
performance conditions. The number of PSAs granted in 2012 to each named executive is provided in the Grants of Plan-Based Awards table on
page 42. The value of the PSAs at grant date share price if maximum corporate performance were to be achieved is as follows: Mr. Wilson
$7,700,028, Mr. Shebik $603,632, Mr. Civgin $1,899,990, Ms. Greffin $1,799,984, Mr. Gupta $1,312,478, and Mr. Winter $2,500,026.
(3) The aggregate grant date fair value of option awards computed in accordance with FASB ASC 718. The fair value of each option award is estimated
on the grant date using a binomial lattice model and the assumptions as set forth in the following table:
Weighted average expected term 9.0 years 7.9 years 7.8 years
Expected volatility 20.2 - 53.9% 22.1 - 53.9% 23.7 - 52.3%
Weighted average volatility 34.6% 35.1% 35.1%
Expected dividends 2.2 - 3.0% 2.5 - 3.7% 2.4 - 2.8%
Weighted average expected dividends 2.8% 2.7% 2.6%
Risk-free rate 0.0 - 2.2% 0.0 - 3.5% 0.1 - 3.9%
40
Change in
Pension Value
and
Non-Equity Nonqualified
Incentive Deferred All
Stock Option Plan Compensation Other
Name and Principal Salary Bonus Awards Awards Compensation Earnings Compensation Total
Position(1) Year ($) ($) ($)(2) ($)(3) ($) ($)(4) ($)(5) ($)
Judith P. Greffin
Suren K. Gupta
Executive Compensation Tables
2012 2011 2010
The Allstate Corporation |
PROXY STATEMENT
Thomas J. Wilson
Steven E. Shebik
Don Civgin
Matthew E. Winter