Allstate 2013 Annual Report Download - page 173
Download and view the complete annual report
Please find page 173 of the 2013 Allstate annual report below. You can navigate through the pages in the report by either clicking on the pages listed below, or by using the keyword search tool below to find specific information within the annual report.-
 1
1 -
2
-
3
-
4
-
5
-
6
-
7
-
8
-
9
-
10
-
11
-
12
-
13
-
14
-
15
-
16
-
17
-
18
-
19
-
20
-
21
-
22
-
23
-
24
-
25
-
26
-
27
-
28
-
29
-
30
-
31
-
32
-
33
-
34
-
35
-
36
-
37
-
38
-
39
-
40
-
41
-
42
-
43
-
44
-
45
-
46
-
47
-
48
-
49
-
50
-
51
-
52
-
53
-
54
-
55
-
56
-
57
-
58
-
59
-
60
-
61
-
62
-
63
-
64
-
65
-
66
-
67
-
68
-
69
-
70
-
71
-
72
-
73
-
74
-
75
-
76
-
77
-
78
-
79
-
80
-
81
-
82
-
83
-
84
-
85
-
86
-
87
-
88
-
89
-
90
-
91
-
92
-
93
-
94
-
95
-
96
-
97
-
98
-
99
-
100
-
101
-
102
-
103
-
104
-
105
-
106
-
107
-
108
-
109
-
110
-
111
-
112
-
113
-
114
-
115
-
116
-
117
-
118
-
119
-
120
-
121
-
122
-
123
-
124
-
125
-
126
-
127
-
128
-
129
-
130
-
131
-
132
-
133
-
134
-
135
-
136
-
137
-
138
-
139
-
140
-
141
-
142
-
143
-
144
-
145
-
146
-
147
-
148
-
149
-
150
-
151
-
152
-
153
-
154
-
155
-
156
-
157
-
158
-
159
-
160
-
161
-
162
-
 163
163 -
 164
164 -
 165
165 -
 166
166 -
 167
167 -
 168
168 -
 169
169 -
 170
170 -
 171
171 -
 172
172 -
 173
173 -
 174
174 -
 175
175 -
 176
176 -
 177
177 -
 178
178 -
 179
179 -
 180
180 -
 181
181 -
 182
182 -
 183
183 -
184
-
185
-
186
-
187
-
188
-
189
-
190
-
191
-
192
-
193
-
194
-
195
-
196
-
197
-
198
-
199
-
200
-
201
-
202
-
203
-
204
-
205
-
206
-
207
-
208
-
209
-
210
-
211
-
212
-
213
-
214
-
215
-
216
-
217
-
218
-
219
-
220
-
221
-
222
-
223
-
224
-
225
-
226
-
227
-
228
-
229
-
230
-
231
-
232
-
233
-
234
-
235
-
236
-
237
-
238
-
239
-
240
-
241
-
242
-
243
-
244
-
245
-
246
-
247
-
248
-
249
-
250
-
251
-
252
-
253
-
254
-
255
-
256
-
257
-
258
-
259
-
260
-
261
-
262
-
263
-
264
-
265
-
266
-
267
-
268
-
269
-
270
-
271
-
272
-
273
-
274
-
275
-
276
-
277
-
278
-
279
-
280
-
281
-
282
-
283
-
284
-
285
-
286
-
287
-
288
-
289
-
290
-
291
-
292
-
293
-
294
-
295
-
296
 |
 |

Benefit spread decreased 7.2% or $45 million in 2012 compared to 2011 primarily due to worse mortality
experience on life insurance and annuities and the reduction in accident and health insurance reserves at Allstate
Benefits in 2011, partially offset by lower reinsurance premiums ceded on life insurance, higher cost of insurance
contract charges on interest-sensitive life insurance and the reduction in reserves for secondary guarantees on interest-
sensitive life insurance.
Benefit spread increased 23.6% or $120 million in 2011 compared to 2010 primarily due to reestimations of reserves
that increased contract benefits for interest-sensitive life insurance and decreased contract benefits for immediate
annuities with life contingencies in 2010, a reduction in accident and health insurance reserves at Allstate Benefits as of
December 31, 2011 related to a contract modification, and favorable morbidity experience on certain accident and health
products and growth at Allstate Benefits.
Interest credited to contractholder funds decreased 20.0% or $329 million in 2012 compared to 2011 primarily due to
the valuation change on derivatives embedded in equity-indexed annuity contracts that reduced interest credited
expense, lower average contractholder funds and lower interest crediting rates. Valuation changes on derivatives
embedded in equity-indexed annuity contracts that are not hedged decreased interest credited to contractholder funds
by $126 million in 2012 compared to an $18 million increase in 2011. During third quarter 2012, we reviewed the
significant valuation inputs for these embedded derivatives and reduced the projected option cost to reflect
management’s current and anticipated crediting rate setting actions, which were informed by the existing and projected
low interest rate environment and are consistent with our strategy to reduce exposure to spread-based business. The
reduction in projected interest rates to the level currently being credited, approximately 2%, resulted in a reduction of
contractholder funds and interest credited expense by $169 million. Amortization of deferred sales inducement costs
was $14 million in 2012 compared to $23 million in 2011.
Interest credited to contractholder funds decreased 9.0% or $162 million in 2011 compared to 2010 primarily due to
lower average contractholder funds and lower interest crediting rates on deferred fixed annuities, interest-sensitive life
insurance and immediate fixed annuities. Additionally, valuation changes on derivatives embedded in equity-indexed
annuity contracts that are not hedged increased interest credited to contractholder funds by $18 million in 2011.
Amortization of deferred sales inducement costs was $23 million in 2011 compared to $27 million in 2010.
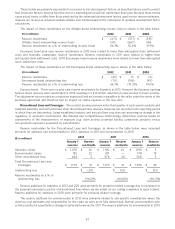
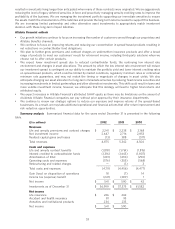
In order to analyze the impact of net investment income and interest credited to contractholders on net income, we
monitor the difference between net investment income and the sum of interest credited to contractholder funds and the
implied interest on immediate annuities with life contingencies, which is included as a component of life and annuity
contract benefits on the Consolidated Statements of Operations (‘‘investment spread’’).
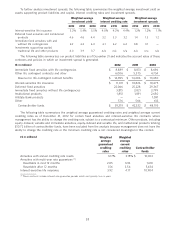
The investment spread by product group for the years ended December 31 is shown in the following table.
($ in millions) 2012 2011 2010
Annuities and institutional products $ 292 $ 188 $ 179
Life insurance 82 54 35
Accident and health insurance 25 19 18
Allstate Bank products — 22 31
Net investment income on investments supporting capital 268 265 234
Investment spread before valuation changes on embedded
derivatives that are not hedged 667 548 497
Valuation changes on derivatives embedded in equity-indexed
annuity contracts that are not hedged 126 (18) —
Total investment spread $ 793 $ 530 $ 497
Investment spread before valuation changes on embedded derivatives that are not hedged increased 21.7% or
$119 million in 2012 compared to 2011 due to income from limited partnerships and lower crediting rates, partially offset
by lower yields on fixed income securities and the continued managed reduction in our spread-based business in force.
Investment spread before valuation changes on embedded derivatives that are not hedged increased 10.3% or
$51 million in 2011 compared to 2010 as actions to improve investment portfolio yields and lower crediting rates more
than offset the effect of the continuing decline in our spread-based business in force. For further analysis on the
valuation changes on derivatives embedded in equity-indexed annuity contracts, see the interest credited to
contractholder funds section.
57