Allstate 2013 Annual Report Download - page 220
Download and view the complete annual report
Please find page 220 of the 2013 Allstate annual report below. You can navigate through the pages in the report by either clicking on the pages listed below, or by using the keyword search tool below to find specific information within the annual report.-
 1
1 -
2
-
3
-
4
-
5
-
6
-
7
-
8
-
9
-
10
-
11
-
12
-
13
-
14
-
15
-
16
-
17
-
18
-
19
-
20
-
21
-
22
-
23
-
24
-
25
-
26
-
27
-
28
-
29
-
30
-
31
-
32
-
33
-
34
-
35
-
36
-
37
-
38
-
39
-
40
-
41
-
42
-
43
-
44
-
45
-
46
-
47
-
48
-
49
-
50
-
51
-
52
-
53
-
54
-
55
-
56
-
57
-
58
-
59
-
60
-
61
-
62
-
63
-
64
-
65
-
66
-
67
-
68
-
69
-
70
-
71
-
72
-
73
-
74
-
75
-
76
-
77
-
78
-
79
-
80
-
81
-
82
-
83
-
84
-
85
-
86
-
87
-
88
-
89
-
90
-
91
-
92
-
93
-
94
-
95
-
96
-
97
-
98
-
99
-
100
-
101
-
102
-
103
-
104
-
105
-
106
-
107
-
108
-
109
-
110
-
111
-
112
-
113
-
114
-
115
-
116
-
117
-
118
-
119
-
120
-
121
-
122
-
123
-
124
-
125
-
126
-
127
-
128
-
129
-
130
-
131
-
132
-
133
-
134
-
135
-
136
-
137
-
138
-
139
-
140
-
141
-
142
-
143
-
144
-
145
-
146
-
147
-
148
-
149
-
150
-
151
-
152
-
153
-
154
-
155
-
156
-
157
-
158
-
159
-
160
-
161
-
162
-
163
-
164
-
165
-
166
-
167
-
168
-
169
-
170
-
171
-
172
-
173
-
174
-
175
-
176
-
177
-
178
-
179
-
180
-
181
-
182
-
183
-
184
-
185
-
186
-
187
-
188
-
189
-
190
-
191
-
192
-
193
-
194
-
195
-
196
-
197
-
198
-
199
-
200
-
201
-
202
-
203
-
204
-
205
-
206
-
207
-
208
-
209
-
 210
210 -
 211
211 -
 212
212 -
 213
213 -
 214
214 -
 215
215 -
 216
216 -
 217
217 -
 218
218 -
 219
219 -
 220
220 -
 221
221 -
 222
222 -
 223
223 -
 224
224 -
 225
225 -
 226
226 -
 227
227 -
 228
228 -
 229
229 -
 230
230 -
231
-
232
-
233
-
234
-
235
-
236
-
237
-
238
-
239
-
240
-
241
-
242
-
243
-
244
-
245
-
246
-
247
-
248
-
249
-
250
-
251
-
252
-
253
-
254
-
255
-
256
-
257
-
258
-
259
-
260
-
261
-
262
-
263
-
264
-
265
-
266
-
267
-
268
-
269
-
270
-
271
-
272
-
273
-
274
-
275
-
276
-
277
-
278
-
279
-
280
-
281
-
282
-
283
-
284
-
285
-
286
-
287
-
288
-
289
-
290
-
291
-
292
-
293
-
294
-
295
-
296
 |
 |

Scheduled maturities
The scheduled maturities for fixed income securities are as follows as of December 31, 2012:
($ in millions) Amortized Fair
cost value
Due in one year or less $ 3,825 $ 3,872
Due after one year through five years 23,168 24,324
Due after five years through ten years 23,808 25,973
Due after ten years 12,981 14,694
63,782 68,863
ABS, RMBS and CMBS 8,133 8,154
Total $ 71,915 $ 77,017
Actual maturities may differ from those scheduled as a result of prepayments by the issuers. ABS, RMBS and CMBS
are shown separately because of the potential for prepayment of principal prior to contractual maturity dates.
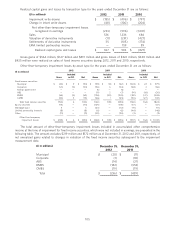
Net investment income
Net investment income for the years ended December 31 is as follows:
($ in millions) 2012 2011 2010
Fixed income securities $ 3,234 $ 3,484 $ 3,737
Equity securities 127 122 90
Mortgage loans 374 359 385
Limited partnership interests (1) 348 88 40
Short-term investments 6 6 8
Other 132 95 19
Investment income, before expense 4,221 4,154 4,279
Investment expense (211) (183) (177)
Net investment income $ 4,010 $ 3,971 $ 4,102
(1) Income from EMA limited partnerships is reported in net investment income in 2012 and realized capital gains and losses in 2011 and
2010.
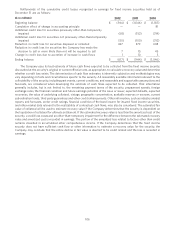
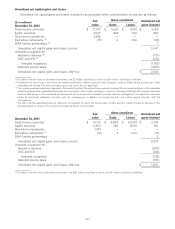
Realized capital gains and losses
Realized capital gains and losses by asset type for the years ended December 31 are as follows:
($ in millions) 2012 2011 2010
Fixed income securities $ 107 $ 712 $ (366)
Equity securities 183 63 153
Mortgage loans 8 (27) (71)
Limited partnership interests (1) 13 159 57
Derivatives 23 (397) (600)
Other (7) (7) —
Realized capital gains and losses $ 327 $ 503 $ (827)
(1) Income from EMA limited partnerships is reported in net investment income in 2012 and realized capital gains and losses in 2011 and
2010.
104