Allstate 2013 Annual Report Download - page 46
Download and view the complete annual report
Please find page 46 of the 2013 Allstate annual report below. You can navigate through the pages in the report by either clicking on the pages listed below, or by using the keyword search tool below to find specific information within the annual report.-
 1
1 -
2
-
3
-
4
-
5
-
6
-
7
-
8
-
9
-
10
-
11
-
12
-
13
-
14
-
15
-
16
-
17
-
18
-
19
-
20
-
21
-
22
-
23
-
24
-
25
-
26
-
27
-
28
-
29
-
30
-
31
-
32
-
33
-
34
-
35
-
 36
36 -
 37
37 -
 38
38 -
 39
39 -
 40
40 -
 41
41 -
 42
42 -
 43
43 -
 44
44 -
 45
45 -
 46
46 -
 47
47 -
 48
48 -
 49
49 -
 50
50 -
 51
51 -
 52
52 -
 53
53 -
 54
54 -
 55
55 -
 56
56 -
57
-
58
-
59
-
60
-
61
-
62
-
63
-
64
-
65
-
66
-
67
-
68
-
69
-
70
-
71
-
72
-
73
-
74
-
75
-
76
-
77
-
78
-
79
-
80
-
81
-
82
-
83
-
84
-
85
-
86
-
87
-
88
-
89
-
90
-
91
-
92
-
93
-
94
-
95
-
96
-
97
-
98
-
99
-
100
-
101
-
102
-
103
-
104
-
105
-
106
-
107
-
108
-
109
-
110
-
111
-
112
-
113
-
114
-
115
-
116
-
117
-
118
-
119
-
120
-
121
-
122
-
123
-
124
-
125
-
126
-
127
-
128
-
129
-
130
-
131
-
132
-
133
-
134
-
135
-
136
-
137
-
138
-
139
-
140
-
141
-
142
-
143
-
144
-
145
-
146
-
147
-
148
-
149
-
150
-
151
-
152
-
153
-
154
-
155
-
156
-
157
-
158
-
159
-
160
-
161
-
162
-
163
-
164
-
165
-
166
-
167
-
168
-
169
-
170
-
171
-
172
-
173
-
174
-
175
-
176
-
177
-
178
-
179
-
180
-
181
-
182
-
183
-
184
-
185
-
186
-
187
-
188
-
189
-
190
-
191
-
192
-
193
-
194
-
195
-
196
-
197
-
198
-
199
-
200
-
201
-
202
-
203
-
204
-
205
-
206
-
207
-
208
-
209
-
210
-
211
-
212
-
213
-
214
-
215
-
216
-
217
-
218
-
219
-
220
-
221
-
222
-
223
-
224
-
225
-
226
-
227
-
228
-
229
-
230
-
231
-
232
-
233
-
234
-
235
-
236
-
237
-
238
-
239
-
240
-
241
-
242
-
243
-
244
-
245
-
246
-
247
-
248
-
249
-
250
-
251
-
252
-
253
-
254
-
255
-
256
-
257
-
258
-
259
-
260
-
261
-
262
-
263
-
264
-
265
-
266
-
267
-
268
-
269
-
270
-
271
-
272
-
273
-
274
-
275
-
276
-
277
-
278
-
279
-
280
-
281
-
282
-
283
-
284
-
285
-
286
-
287
-
288
-
289
-
290
-
291
-
292
-
293
-
294
-
295
-
296
 |
 |

22MAR201312074755
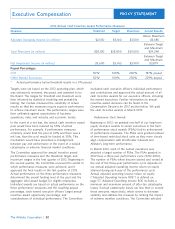
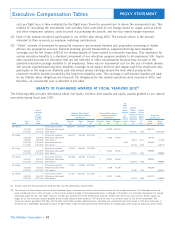
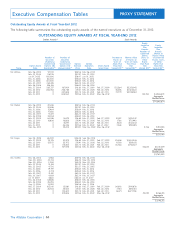
Mr. Wilson 124,194 41,398 Maximum 82,796
Mr. Shebik 9,736 3,245 Maximum 6,490
Mr. Civgin 30,645 10,215 Maximum 20,430
Ms. Greffin 29,032 9,677 Maximum 19,354
Mr. Gupta 21,169 7,056 Maximum 14,112
Mr. Winter 40,323 13,441 Maximum 26,882
In response to stockholder feedback, we are disclosing the ranges of performance for the 2013-2015 PSA performance
cycle. The 2013-2015 performance cycle uses the same design as the 2012-2014 cycle adjusted to reflect an updated
maximum and minimum amount of catastrophe losses. The Committee considered historical and expected performance
when approving the ranges of performance for the 2013-2015 performance cycle.
6.0% 11.0% 12.5%
6.0% 12.0% 13.5%
6.0% 13.0% 14.5%
0% 100% 200%
Subject to
positive net
income hurdle
Compensation Decisions for 2012 package, including salary, annual cash incentive awards,
and long-term incentive awards, and then presents its
Mr. Wilson, Chairman, President and Chief Executive Officer recommendations to the Board within this total
As stated in its charter, one of the Committee’s most compensation framework.
important responsibilities is to recommend the CEO’s Mr. Wilson’s total compensation and the amount of each
compensation to the Board. The Committee establishes compensation element are driven by the design of our
the CEO’s goals and, in conjunction with the nominating compensation program, his experience, responsibility for
and governance committee, evaluates performance based Allstate’s overall strategic direction, performance, and
on predetermined goals and actual results. When operations, and the Committee’s analysis of peer company
reviewing performance relative to these goals, the Board CEO compensation. In conjunction with the Committee’s
discusses the Committee’s recommendations in executive independent compensation consultant, the Committee
session, without the CEO present. The Committee fulfills conducts an annual review of Mr. Wilson’s total target
its oversight responsibilities and provides meaningful direct compensation and determines if any changes are
recommendations to the Board by analyzing competitive warranted.
compensation data provided by its independent
compensation consultant and company performance data. During the 2012 annual review, it was determined that
The Committee reviews the various elements of the CEO’s Mr. Wilson’s compensation opportunity should be
compensation in the context of the total compensation increased to align with Allstate’s practice of targeting
34
Executive Compensation
Target Number Target Number Number of
of PSAs of PSAs Achievement PSAs
(2012-2014 (2012 for 2012 Earned (2012
Performance Measurement Measurement Measurement
Named Executive Cycle) Period) Period Period)
2013-2015 Performance Stock Awards Ranges of Performance
Annual Adjusted Operating
Income Return on Equity Threshold Target Maximum
Measurement Period 2013
Measurement Period 2014
Measurement Period 2015
Payout
The Allstate Corporation |
PROXY STATEMENT