Allstate 2013 Annual Report Download - page 159
Download and view the complete annual report
Please find page 159 of the 2013 Allstate annual report below. You can navigate through the pages in the report by either clicking on the pages listed below, or by using the keyword search tool below to find specific information within the annual report.-
 1
1 -
2
-
3
-
4
-
5
-
6
-
7
-
8
-
9
-
10
-
11
-
12
-
13
-
14
-
15
-
16
-
17
-
18
-
19
-
20
-
21
-
22
-
23
-
24
-
25
-
26
-
27
-
28
-
29
-
30
-
31
-
32
-
33
-
34
-
35
-
36
-
37
-
38
-
39
-
40
-
41
-
42
-
43
-
44
-
45
-
46
-
47
-
48
-
49
-
50
-
51
-
52
-
53
-
54
-
55
-
56
-
57
-
58
-
59
-
60
-
61
-
62
-
63
-
64
-
65
-
66
-
67
-
68
-
69
-
70
-
71
-
72
-
73
-
74
-
75
-
76
-
77
-
78
-
79
-
80
-
81
-
82
-
83
-
84
-
85
-
86
-
87
-
88
-
89
-
90
-
91
-
92
-
93
-
94
-
95
-
96
-
97
-
98
-
99
-
100
-
101
-
102
-
103
-
104
-
105
-
106
-
107
-
108
-
109
-
110
-
111
-
112
-
113
-
114
-
115
-
116
-
117
-
118
-
119
-
120
-
121
-
122
-
123
-
124
-
125
-
126
-
127
-
128
-
129
-
130
-
131
-
132
-
133
-
134
-
135
-
136
-
137
-
138
-
139
-
140
-
141
-
142
-
143
-
144
-
145
-
146
-
147
-
148
-
 149
149 -
 150
150 -
 151
151 -
 152
152 -
 153
153 -
 154
154 -
 155
155 -
 156
156 -
 157
157 -
 158
158 -
 159
159 -
 160
160 -
 161
161 -
 162
162 -
 163
163 -
 164
164 -
 165
165 -
 166
166 -
 167
167 -
 168
168 -
 169
169 -
170
-
171
-
172
-
173
-
174
-
175
-
176
-
177
-
178
-
179
-
180
-
181
-
182
-
183
-
184
-
185
-
186
-
187
-
188
-
189
-
190
-
191
-
192
-
193
-
194
-
195
-
196
-
197
-
198
-
199
-
200
-
201
-
202
-
203
-
204
-
205
-
206
-
207
-
208
-
209
-
210
-
211
-
212
-
213
-
214
-
215
-
216
-
217
-
218
-
219
-
220
-
221
-
222
-
223
-
224
-
225
-
226
-
227
-
228
-
229
-
230
-
231
-
232
-
233
-
234
-
235
-
236
-
237
-
238
-
239
-
240
-
241
-
242
-
243
-
244
-
245
-
246
-
247
-
248
-
249
-
250
-
251
-
252
-
253
-
254
-
255
-
256
-
257
-
258
-
259
-
260
-
261
-
262
-
263
-
264
-
265
-
266
-
267
-
268
-
269
-
270
-
271
-
272
-
273
-
274
-
275
-
276
-
277
-
278
-
279
-
280
-
281
-
282
-
283
-
284
-
285
-
286
-
287
-
288
-
289
-
290
-
291
-
292
-
293
-
294
-
295
-
296
 |
 |

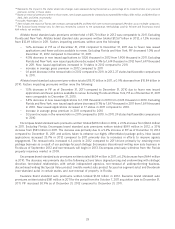
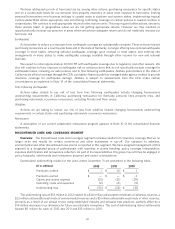
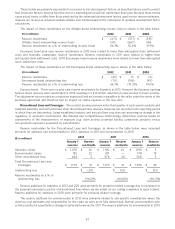
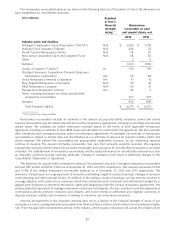
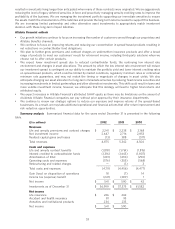
Net realized capital gains and losses are presented in the following table.
($ in millions) 2012 2011 2010
Impairment write-downs $ (134) $ (250) $ (295)
Change in intent write-downs (31) (49) (62)
Net other-than-temporary impairment losses
recognized in earnings (165) (299) (357)
Sales 511 469 455
Valuation of derivative instruments 5 (54) (331)
Settlements of derivative instruments (16) (127) (143)
EMA limited partnership income (1) —9655
Realized capital gains and losses, pre-tax 335 85 (321)
Income tax (expense) benefit (114) (31) 114
Realized capital gains and losses, after-tax $ 221 $ 54 $ (207)
(1) Income from EMA limited partnerships is reported in net investment income in 2012 and realized capital gains and
losses in 2011 and 2010.
For a further discussion of net realized capital gains and losses, see the Investments section of the MD&A.
PROPERTY-LIABILITY CLAIMS AND CLAIMS EXPENSE RESERVES
Property-Liability underwriting results are significantly influenced by estimates of property-liability claims and
claims expense reserves. For a description of our reserve process, see Note 8 of the consolidated financial statements
and for a further description of our reserving policies and the potential variability in our reserve estimates, see the
Application of Critical Accounting Estimates section of the MD&A. These reserves are an estimate of amounts
necessary to settle all outstanding claims, including IBNR claims, as of the reporting date.
The facts and circumstances leading to our reestimates of reserves relate to revisions to the development factors
used to predict how losses are likely to develop from the end of a reporting period until all claims have been paid.
Reestimates occur because actual losses are likely different than those predicted by the estimated development factors
used in prior reserve estimates. As of December 31, 2012, the impact of a reserve reestimation corresponding to a one
percent increase or decrease in net reserves would be a decrease or increase of approximately $112 million in net
income.
We believe the net loss reserves for Allstate Protection exposures are appropriately established based on available
facts, technology, laws and regulations.
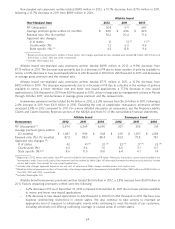
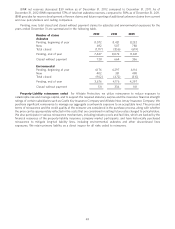
The table below shows total net reserves as of December 31 by line of business.
($ in millions) 2012 2011 2010
Allstate brand $ 14,364 $ 14,792 $ 14,696
Encompass brand 807 859 921
Esurance brand 470 429 —
Total Allstate Protection 15,641 16,080 15,617
Discontinued Lines and Coverages 1,637 1,707 1,779
Total Property-Liability $ 17,278 $ 17,787 $ 17,396
43