Allstate 2013 Annual Report Download - page 281
Download and view the complete annual report
Please find page 281 of the 2013 Allstate annual report below. You can navigate through the pages in the report by either clicking on the pages listed below, or by using the keyword search tool below to find specific information within the annual report.-
 1
1 -
2
-
3
-
4
-
5
-
6
-
7
-
8
-
9
-
10
-
11
-
12
-
13
-
14
-
15
-
16
-
17
-
18
-
19
-
20
-
21
-
22
-
23
-
24
-
25
-
26
-
27
-
28
-
29
-
30
-
31
-
32
-
33
-
34
-
35
-
36
-
37
-
38
-
39
-
40
-
41
-
42
-
43
-
44
-
45
-
46
-
47
-
48
-
49
-
50
-
51
-
52
-
53
-
54
-
55
-
56
-
57
-
58
-
59
-
60
-
61
-
62
-
63
-
64
-
65
-
66
-
67
-
68
-
69
-
70
-
71
-
72
-
73
-
74
-
75
-
76
-
77
-
78
-
79
-
80
-
81
-
82
-
83
-
84
-
85
-
86
-
87
-
88
-
89
-
90
-
91
-
92
-
93
-
94
-
95
-
96
-
97
-
98
-
99
-
100
-
101
-
102
-
103
-
104
-
105
-
106
-
107
-
108
-
109
-
110
-
111
-
112
-
113
-
114
-
115
-
116
-
117
-
118
-
119
-
120
-
121
-
122
-
123
-
124
-
125
-
126
-
127
-
128
-
129
-
130
-
131
-
132
-
133
-
134
-
135
-
136
-
137
-
138
-
139
-
140
-
141
-
142
-
143
-
144
-
145
-
146
-
147
-
148
-
149
-
150
-
151
-
152
-
153
-
154
-
155
-
156
-
157
-
158
-
159
-
160
-
161
-
162
-
163
-
164
-
165
-
166
-
167
-
168
-
169
-
170
-
171
-
172
-
173
-
174
-
175
-
176
-
177
-
178
-
179
-
180
-
181
-
182
-
183
-
184
-
185
-
186
-
187
-
188
-
189
-
190
-
191
-
192
-
193
-
194
-
195
-
196
-
197
-
198
-
199
-
200
-
201
-
202
-
203
-
204
-
205
-
206
-
207
-
208
-
209
-
210
-
211
-
212
-
213
-
214
-
215
-
216
-
217
-
218
-
219
-
220
-
221
-
222
-
223
-
224
-
225
-
226
-
227
-
228
-
229
-
230
-
231
-
232
-
233
-
234
-
235
-
236
-
237
-
238
-
239
-
240
-
241
-
242
-
243
-
244
-
245
-
246
-
247
-
248
-
249
-
250
-
251
-
252
-
253
-
254
-
255
-
256
-
257
-
258
-
259
-
260
-
261
-
262
-
263
-
264
-
265
-
266
-
267
-
268
-
269
-
270
-
 271
271 -
 272
272 -
 273
273 -
 274
274 -
 275
275 -
 276
276 -
 277
277 -
 278
278 -
 279
279 -
 280
280 -
 281
281 -
 282
282 -
 283
283 -
 284
284 -
 285
285 -
 286
286 -
 287
287 -
 288
288 -
 289
289 -
 290
290 -
 291
291 -
292
-
293
-
294
-
295
-
296
 |
 |

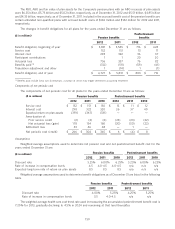
2010, the Company no longer participates in the Retiree Drug Subsidy program due to the change in the Company’s
retiree medical plan for Medicare-eligible retirees.
Postretirement benefits
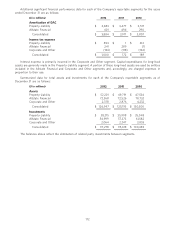
($ in millions)
Gross
Pension benefit
benefits payments
2013 $ 318 $ 44
2014 345 45
2015 357 47
2016 383 48
2017 417 50
2018-2022 2,483 275
Total benefit payments $ 4,303 $ 509
Allstate 401(k) Savings Plan
Employees of the Company, with the exception of those employed by the Company’s international, Sterling Collision
Centers (‘‘Sterling’’), Esurance and Answer Financial subsidiaries, are eligible to become members of the Allstate 401(k)
Savings Plan (‘‘Allstate Plan’’). The Company’s contributions are based on the Company’s matching obligation and
certain performance measures. The Company is responsible for funding its anticipated contribution to the Allstate Plan,
and may, at the discretion of management, use the ESOP to pre-fund certain portions. In connection with the Allstate
Plan, the Company has a note from the ESOP with a principal balance of $22 million as of December 31, 2012. The ESOP
note has a fixed interest rate of 7.9% and matures in 2019. The Company records dividends on the ESOP shares in
retained income and all the shares held by the ESOP are included in basic and diluted weighted average common shares
outstanding.
The Company’s contribution to the Allstate Plan was $52 million, $48 million and $36 million in 2012, 2011 and
2010, respectively. These amounts were reduced by the ESOP benefit computed for the years ended December 31 as
follows:
($ in millions) 2012 2011 2010
Interest expense recognized by ESOP $ 2 $ 2 $ 2
Less: dividends accrued on ESOP shares (2) (2) (2)
Cost of shares allocated 2 2 2
Compensation expense 2 2 2
Reduction of defined contribution due to ESOP 10 9 11
ESOP benefit $ (8) $ (7) $ (9)
The Company made no contributions to the ESOP in 2012, 2011 and 2010. As of December 31, 2012, total
committed to be released, allocated and unallocated ESOP shares were 0.2 million, 34 million and 5 million,
respectively.
Allstate’s Canadian, Sterling, Esurance and Answer Financial subsidiaries sponsor defined contribution plans for
their eligible employees. Expense for these plans was $7 million, $7 million and $5 million in 2012, 2011 and 2010,
respectively.
18. Equity Incentive Plans
The Company currently has equity incentive plans under which the Company grants nonqualified stock options,
restricted stock units and performance stock awards to certain employees and directors of the Company. The total
compensation expense related to equity awards was $86 million, $64 million and $68 million and the total income tax
benefits were $30 million, $21 million and $23 million for 2012, 2011 and 2010, respectively. Total cash received from the
exercise of options was $99 million, $19 million and $28 million for 2012, 2011 and 2010, respectively. Total tax benefit
realized on options exercised and stock unrestricted was $28 million, $10 million and $11 million for 2012, 2011 and
2010, respectively.
The Company records compensation expense related to awards under these plans over the shorter of the period in
which the requisite service is rendered or retirement eligibility is attained. Compensation expense for performance share
165