Allstate 2013 Annual Report Download - page 227
Download and view the complete annual report
Please find page 227 of the 2013 Allstate annual report below. You can navigate through the pages in the report by either clicking on the pages listed below, or by using the keyword search tool below to find specific information within the annual report.-
 1
1 -
2
-
3
-
4
-
5
-
6
-
7
-
8
-
9
-
10
-
11
-
12
-
13
-
14
-
15
-
16
-
17
-
18
-
19
-
20
-
21
-
22
-
23
-
24
-
25
-
26
-
27
-
28
-
29
-
30
-
31
-
32
-
33
-
34
-
35
-
36
-
37
-
38
-
39
-
40
-
41
-
42
-
43
-
44
-
45
-
46
-
47
-
48
-
49
-
50
-
51
-
52
-
53
-
54
-
55
-
56
-
57
-
58
-
59
-
60
-
61
-
62
-
63
-
64
-
65
-
66
-
67
-
68
-
69
-
70
-
71
-
72
-
73
-
74
-
75
-
76
-
77
-
78
-
79
-
80
-
81
-
82
-
83
-
84
-
85
-
86
-
87
-
88
-
89
-
90
-
91
-
92
-
93
-
94
-
95
-
96
-
97
-
98
-
99
-
100
-
101
-
102
-
103
-
104
-
105
-
106
-
107
-
108
-
109
-
110
-
111
-
112
-
113
-
114
-
115
-
116
-
117
-
118
-
119
-
120
-
121
-
122
-
123
-
124
-
125
-
126
-
127
-
128
-
129
-
130
-
131
-
132
-
133
-
134
-
135
-
136
-
137
-
138
-
139
-
140
-
141
-
142
-
143
-
144
-
145
-
146
-
147
-
148
-
149
-
150
-
151
-
152
-
153
-
154
-
155
-
156
-
157
-
158
-
159
-
160
-
161
-
162
-
163
-
164
-
165
-
166
-
167
-
168
-
169
-
170
-
171
-
172
-
173
-
174
-
175
-
176
-
177
-
178
-
179
-
180
-
181
-
182
-
183
-
184
-
185
-
186
-
187
-
188
-
189
-
190
-
191
-
192
-
193
-
194
-
195
-
196
-
197
-
198
-
199
-
200
-
201
-
202
-
203
-
204
-
205
-
206
-
207
-
208
-
209
-
210
-
211
-
212
-
213
-
214
-
215
-
216
-
 217
217 -
 218
218 -
 219
219 -
 220
220 -
 221
221 -
 222
222 -
 223
223 -
 224
224 -
 225
225 -
 226
226 -
 227
227 -
 228
228 -
 229
229 -
 230
230 -
 231
231 -
 232
232 -
 233
233 -
 234
234 -
 235
235 -
 236
236 -
 237
237 -
238
-
239
-
240
-
241
-
242
-
243
-
244
-
245
-
246
-
247
-
248
-
249
-
250
-
251
-
252
-
253
-
254
-
255
-
256
-
257
-
258
-
259
-
260
-
261
-
262
-
263
-
264
-
265
-
266
-
267
-
268
-
269
-
270
-
271
-
272
-
273
-
274
-
275
-
276
-
277
-
278
-
279
-
280
-
281
-
282
-
283
-
284
-
285
-
286
-
287
-
288
-
289
-
290
-
291
-
292
-
293
-
294
-
295
-
296
 |
 |

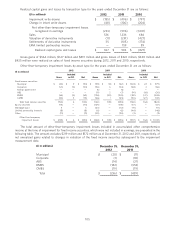
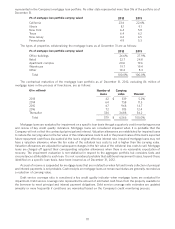
represented in the Company’s mortgage loan portfolio. No other state represented more than 5% of the portfolio as of
December 31.
(% of mortgage loan portfolio carrying value) 2012 2011
California 23.6 22.6%
Illinois 8.1 9.1
New York 6.4 5.8
Texas 6.4 6.2
New Jersey 6.2 6.5
Pennsylvania 4.9 5.3
The types of properties collateralizing the mortgage loans as of December 31 are as follows:
(% of mortgage loan portfolio carrying value) 2012 2011
Office buildings 26.6% 27.9%
Retail 22.7 24.8
Apartment complex 20.6 19.6
Warehouse 19.7 19.4
Other 10.4 8.3
Total 100.0% 100.0%
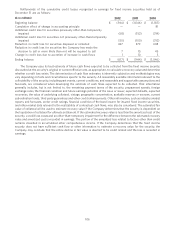
The contractual maturities of the mortgage loan portfolio as of December 31, 2012, excluding $4 million of
mortgage loans in the process of foreclosure, are as follows:
($ in millions) Number of Carrying
loans value Percent
2013 42 $ 339 5.2%
2014 64 758 11.5
2015 67 968 14.7
2016 72 813 12.4
Thereafter 334 3,688 56.2
Total 579 $ 6,566 100.0%
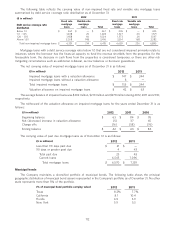
Mortgage loans are evaluated for impairment on a specific loan basis through a quarterly credit monitoring process
and review of key credit quality indicators. Mortgage loans are considered impaired when it is probable that the
Company will not collect the contractual principal and interest. Valuation allowances are established for impaired loans
to reduce the carrying value to the fair value of the collateral less costs to sell or the present value of the loan’s expected
future repayment cash flows discounted at the loan’s original effective interest rate. Impaired mortgage loans may not
have a valuation allowance when the fair value of the collateral less costs to sell is higher than the carrying value.
Valuation allowances are adjusted for subsequent changes in the fair value of the collateral less costs to sell. Mortgage
loans are charged off against their corresponding valuation allowances when there is no reasonable expectation of
recovery. The impairment evaluation is non-statistical in respect to the aggregate portfolio but considers facts and
circumstances attributable to each loan. It is not considered probable that additional impairment losses, beyond those
identified on a specific loan basis, have been incurred as of December 31, 2012.
Accrual of income is suspended for mortgage loans that are in default or when full and timely collection of principal
and interest payments is not probable. Cash receipts on mortgage loans on nonaccrual status are generally recorded as
a reduction of carrying value.
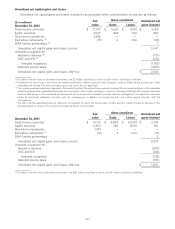
Debt service coverage ratio is considered a key credit quality indicator when mortgage loans are evaluated for
impairment. Debt service coverage ratio represents the amount of estimated cash flows from the property available to
the borrower to meet principal and interest payment obligations. Debt service coverage ratio estimates are updated
annually or more frequently if conditions are warranted based on the Company’s credit monitoring process.
111