Allstate 2013 Annual Report Download - page 183
Download and view the complete annual report
Please find page 183 of the 2013 Allstate annual report below. You can navigate through the pages in the report by either clicking on the pages listed below, or by using the keyword search tool below to find specific information within the annual report.-
 1
1 -
2
-
3
-
4
-
5
-
6
-
7
-
8
-
9
-
10
-
11
-
12
-
13
-
14
-
15
-
16
-
17
-
18
-
19
-
20
-
21
-
22
-
23
-
24
-
25
-
26
-
27
-
28
-
29
-
30
-
31
-
32
-
33
-
34
-
35
-
36
-
37
-
38
-
39
-
40
-
41
-
42
-
43
-
44
-
45
-
46
-
47
-
48
-
49
-
50
-
51
-
52
-
53
-
54
-
55
-
56
-
57
-
58
-
59
-
60
-
61
-
62
-
63
-
64
-
65
-
66
-
67
-
68
-
69
-
70
-
71
-
72
-
73
-
74
-
75
-
76
-
77
-
78
-
79
-
80
-
81
-
82
-
83
-
84
-
85
-
86
-
87
-
88
-
89
-
90
-
91
-
92
-
93
-
94
-
95
-
96
-
97
-
98
-
99
-
100
-
101
-
102
-
103
-
104
-
105
-
106
-
107
-
108
-
109
-
110
-
111
-
112
-
113
-
114
-
115
-
116
-
117
-
118
-
119
-
120
-
121
-
122
-
123
-
124
-
125
-
126
-
127
-
128
-
129
-
130
-
131
-
132
-
133
-
134
-
135
-
136
-
137
-
138
-
139
-
140
-
141
-
142
-
143
-
144
-
145
-
146
-
147
-
148
-
149
-
150
-
151
-
152
-
153
-
154
-
155
-
156
-
157
-
158
-
159
-
160
-
161
-
162
-
163
-
164
-
165
-
166
-
167
-
168
-
169
-
170
-
171
-
172
-
 173
173 -
 174
174 -
 175
175 -
 176
176 -
 177
177 -
 178
178 -
 179
179 -
 180
180 -
 181
181 -
 182
182 -
 183
183 -
 184
184 -
 185
185 -
 186
186 -
 187
187 -
 188
188 -
 189
189 -
 190
190 -
 191
191 -
 192
192 -
 193
193 -
194
-
195
-
196
-
197
-
198
-
199
-
200
-
201
-
202
-
203
-
204
-
205
-
206
-
207
-
208
-
209
-
210
-
211
-
212
-
213
-
214
-
215
-
216
-
217
-
218
-
219
-
220
-
221
-
222
-
223
-
224
-
225
-
226
-
227
-
228
-
229
-
230
-
231
-
232
-
233
-
234
-
235
-
236
-
237
-
238
-
239
-
240
-
241
-
242
-
243
-
244
-
245
-
246
-
247
-
248
-
249
-
250
-
251
-
252
-
253
-
254
-
255
-
256
-
257
-
258
-
259
-
260
-
261
-
262
-
263
-
264
-
265
-
266
-
267
-
268
-
269
-
270
-
271
-
272
-
273
-
274
-
275
-
276
-
277
-
278
-
279
-
280
-
281
-
282
-
283
-
284
-
285
-
286
-
287
-
288
-
289
-
290
-
291
-
292
-
293
-
294
-
295
-
296
 |
 |

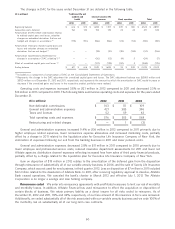
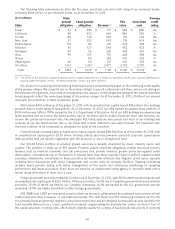
Limited partnership interests consist of investments in private equity/debt funds, real estate funds, hedge funds
and tax credit funds. The limited partnership interests portfolio is well diversified across a number of characteristics
including fund managers, vintage years, strategies, geography (including international), and company/property types.
The following table presents information about our limited partnership interests as of December 31, 2012.
($ in millions) Private Tax
equity/debt Real estate Hedge credit
funds funds funds funds Total
Cost method of accounting (‘‘Cost’’) $ 912 $ 448 $ 46 $ — $ 1,406
Equity method of accounting (‘‘EMA’’) 1,439 1,115 293 669 3,516
Total $ 2,351 (1) $ 1,563 $ 339 $ 669 $ 4,922
Number of managers 98 45 14 11
Number of individual funds 165 96 38 21
Largest exposure to single fund $ 123 $ 224 $ 83 $ 56
(1) Includes $479 million of infrastructure and real asset funds.
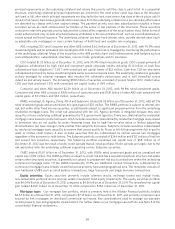
The following table shows the earnings from our limited partnership interests by fund type and accounting
classification for the years ended December 31.
2012 2011
($ in millions)
Total Impairment Total Impairment
Cost EMA (1) income write-downs Cost EMA (1) income write-downs
Private equity/debt funds $ 94 $ 152 $ 246 $ (2) $ 77 $ 72 $ 149 $ (3)
Real estate funds 17 106 123 (4) 12 86 98 (3)
Hedge funds — 7 7 (2) — 12 12 —
Tax credit funds — (28) (28) — (1) (11) (12) —
Total $ 111 $ 237 $ 348 $ (8) $ 88 $ 159 $ 247 $ (6)
(1) Income from EMA limited partnerships is reported in net investment income in 2012 and realized capital gains and losses in 2011.
Limited partnership interests produced income, excluding impairment write-downs, of $348 million in 2012
compared to $247 million in 2011. Income on EMA limited partnerships is recognized on a delay due to the availability of
the related financial statements. The recognition of income on hedge funds is primarily on a one-month delay and the
income recognition on private equity/debt funds, real estate funds and tax credit funds are generally on a three-month
delay. Income on cost method limited partnerships is recognized only upon receipt of amounts distributed by the
partnerships.
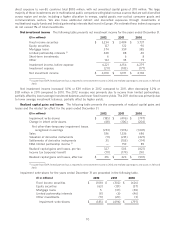
Short-term investments Our short-term investment portfolio was $2.34 billion and $1.29 billion as of
December 31, 2012 and 2011, respectively.
Other investments Our other investments as of December 31, 2012 primarily comprise $1.14 billion of policy
loans, $682 million of bank loans, $319 million of agent loans and $133 million of certain derivatives. For further detail on
our use of derivatives, see Note 7 of the consolidated financial statements.
Unrealized net capital gains totaled $5.55 billion as of December 31, 2012 compared to $2.88 billion as of
December 31, 2011. The increase for fixed income securities was due to tightening credit spreads and decreasing
67