Allstate 2013 Annual Report Download - page 177
Download and view the complete annual report
Please find page 177 of the 2013 Allstate annual report below. You can navigate through the pages in the report by either clicking on the pages listed below, or by using the keyword search tool below to find specific information within the annual report.-
 1
1 -
2
-
3
-
4
-
5
-
6
-
7
-
8
-
9
-
10
-
11
-
12
-
13
-
14
-
15
-
16
-
17
-
18
-
19
-
20
-
21
-
22
-
23
-
24
-
25
-
26
-
27
-
28
-
29
-
30
-
31
-
32
-
33
-
34
-
35
-
36
-
37
-
38
-
39
-
40
-
41
-
42
-
43
-
44
-
45
-
46
-
47
-
48
-
49
-
50
-
51
-
52
-
53
-
54
-
55
-
56
-
57
-
58
-
59
-
60
-
61
-
62
-
63
-
64
-
65
-
66
-
67
-
68
-
69
-
70
-
71
-
72
-
73
-
74
-
75
-
76
-
77
-
78
-
79
-
80
-
81
-
82
-
83
-
84
-
85
-
86
-
87
-
88
-
89
-
90
-
91
-
92
-
93
-
94
-
95
-
96
-
97
-
98
-
99
-
100
-
101
-
102
-
103
-
104
-
105
-
106
-
107
-
108
-
109
-
110
-
111
-
112
-
113
-
114
-
115
-
116
-
117
-
118
-
119
-
120
-
121
-
122
-
123
-
124
-
125
-
126
-
127
-
128
-
129
-
130
-
131
-
132
-
133
-
134
-
135
-
136
-
137
-
138
-
139
-
140
-
141
-
142
-
143
-
144
-
145
-
146
-
147
-
148
-
149
-
150
-
151
-
152
-
153
-
154
-
155
-
156
-
157
-
158
-
159
-
160
-
161
-
162
-
163
-
164
-
165
-
166
-
 167
167 -
 168
168 -
 169
169 -
 170
170 -
 171
171 -
 172
172 -
 173
173 -
 174
174 -
 175
175 -
 176
176 -
 177
177 -
 178
178 -
 179
179 -
 180
180 -
 181
181 -
 182
182 -
 183
183 -
 184
184 -
 185
185 -
 186
186 -
 187
187 -
188
-
189
-
190
-
191
-
192
-
193
-
194
-
195
-
196
-
197
-
198
-
199
-
200
-
201
-
202
-
203
-
204
-
205
-
206
-
207
-
208
-
209
-
210
-
211
-
212
-
213
-
214
-
215
-
216
-
217
-
218
-
219
-
220
-
221
-
222
-
223
-
224
-
225
-
226
-
227
-
228
-
229
-
230
-
231
-
232
-
233
-
234
-
235
-
236
-
237
-
238
-
239
-
240
-
241
-
242
-
243
-
244
-
245
-
246
-
247
-
248
-
249
-
250
-
251
-
252
-
253
-
254
-
255
-
256
-
257
-
258
-
259
-
260
-
261
-
262
-
263
-
264
-
265
-
266
-
267
-
268
-
269
-
270
-
271
-
272
-
273
-
274
-
275
-
276
-
277
-
278
-
279
-
280
-
281
-
282
-
283
-
284
-
285
-
286
-
287
-
288
-
289
-
290
-
291
-
292
-
293
-
294
-
295
-
296
 |
 |

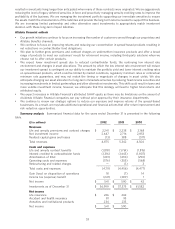
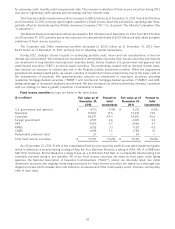
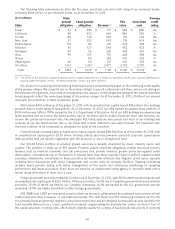
Our reinsurance recoverables, summarized by reinsurer as of December 31, are shown in the following table.
($ in millions) Standard & Poor’s Reinsurance
financial recoverable on paid
strength rating (4) and unpaid benefits
2012 2011
Prudential Insurance Company of America AA- $ 1,691 $ 1,681
Employers Reassurance Corporation A+ 1,059 960
Transamerica Life Group AA- 447 454
RGA Reinsurance Company AA- 361 359
Swiss Re Life and Health America, Inc. (1) AA- 217 212
Scottish Re Group (2) N/A 131 134
Munich American Reassurance AA- 131 127
Paul Revere Life Insurance Company A 127 132
Mutual of Omaha Insurance A+ 96 96
Security Life of Denver A- 83 71
Manulife Insurance Company AA- 62 64
Lincoln National Life Insurance AA- 60 63
Triton Insurance Company N/A 55 56
American Health & Life Insurance Co. N/A 45 48
Other (3) 123 120
Total $ 4,688 $ 4,577
(1) The Company has extensive reinsurance contracts directly with Swiss Re and its affiliates and indirectly through Swiss
Re’s acquisition of other companies with whom we had reinsurance or retrocession contracts.
(2) The reinsurance recoverable on paid and unpaid benefits related to the Scottish Re Group as of December 31, 2012
comprised $71 million related to Scottish Re Life Corporation and $60 million related to Scottish Re (U.S.), Inc. The
reinsurance recoverable on paid and unpaid benefits related to the Scottish Re Group as of December 31, 2011
comprised $73 million related to Scottish Re Life Corporation and $61 million related to Scottish Re (U.S.), Inc.
(3) As of December 31, 2012 and 2011, the other category includes $106 million and $103 million, respectively, of
recoverables due from reinsurers with an investment grade credit rating from Standard & Poor’s (‘‘S&P’’).
(4) N/A reflects no rating available.
We continuously monitor the creditworthiness of reinsurers in order to determine our risk of recoverability on an
individual and aggregate basis, and a provision for uncollectible reinsurance is recorded if needed. No amounts have
been deemed unrecoverable in the three-years ended December 31, 2012.
We enter into certain intercompany reinsurance transactions for the Allstate Financial operations in order to
maintain underwriting control and manage insurance risk among various legal entities. These reinsurance agreements
have been approved by the appropriate regulatory authorities. All significant intercompany transactions have been
eliminated in consolidation.
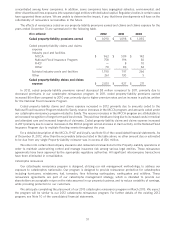
INVESTMENTS 2012 HIGHLIGHTS
• Investments totaled $97.28 billion as of December 31, 2012, an increase of 1.7% from $95.62 billion as of
December 31, 2011.
• Unrealized net capital gains totaled $5.55 billion as of December 31, 2012, increasing from $2.88 billion as of
December 31, 2011.
• Net investment income was $4.01 billion in 2012, an increase of 1.0% from $3.97 billion in 2011.
• Net realized capital gains were $327 million in 2012 compared to $503 million in 2011.
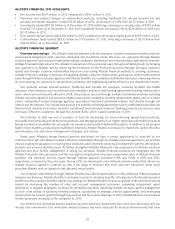
INVESTMENTS
Overview and strategy The return on our investment portfolios is an important component of our financial
results. Investment portfolios are segmented between the Property-Liability, Allstate Financial and Corporate and Other
operations. While taking into consideration the investment portfolio in aggregate, we manage the underlying portfolios
based upon the nature of each respective business and its corresponding liability structure.
We employ a strategic asset allocation approach which considers the nature of the liabilities and risk tolerances, as
well as the risk and return parameters of the various asset classes in which we invest. This asset allocation is informed
by our global economic and market outlook, as well as other inputs and constraints, including diversification effects,
61