Allstate 2013 Annual Report Download - page 129
Download and view the complete annual report
Please find page 129 of the 2013 Allstate annual report below. You can navigate through the pages in the report by either clicking on the pages listed below, or by using the keyword search tool below to find specific information within the annual report.-
 1
1 -
2
-
3
-
4
-
5
-
6
-
7
-
8
-
9
-
10
-
11
-
12
-
13
-
14
-
15
-
16
-
17
-
18
-
19
-
20
-
21
-
22
-
23
-
24
-
25
-
26
-
27
-
28
-
29
-
30
-
31
-
32
-
33
-
34
-
35
-
36
-
37
-
38
-
39
-
40
-
41
-
42
-
43
-
44
-
45
-
46
-
47
-
48
-
49
-
50
-
51
-
52
-
53
-
54
-
55
-
56
-
57
-
58
-
59
-
60
-
61
-
62
-
63
-
64
-
65
-
66
-
67
-
68
-
69
-
70
-
71
-
72
-
73
-
74
-
75
-
76
-
77
-
78
-
79
-
80
-
81
-
82
-
83
-
84
-
85
-
86
-
87
-
88
-
89
-
90
-
91
-
92
-
93
-
94
-
95
-
96
-
97
-
98
-
99
-
100
-
101
-
102
-
103
-
104
-
105
-
106
-
107
-
108
-
109
-
110
-
111
-
112
-
113
-
114
-
115
-
116
-
117
-
118
-
 119
119 -
 120
120 -
 121
121 -
 122
122 -
 123
123 -
 124
124 -
 125
125 -
 126
126 -
 127
127 -
 128
128 -
 129
129 -
 130
130 -
 131
131 -
 132
132 -
 133
133 -
 134
134 -
 135
135 -
 136
136 -
 137
137 -
 138
138 -
 139
139 -
140
-
141
-
142
-
143
-
144
-
145
-
146
-
147
-
148
-
149
-
150
-
151
-
152
-
153
-
154
-
155
-
156
-
157
-
158
-
159
-
160
-
161
-
162
-
163
-
164
-
165
-
166
-
167
-
168
-
169
-
170
-
171
-
172
-
173
-
174
-
175
-
176
-
177
-
178
-
179
-
180
-
181
-
182
-
183
-
184
-
185
-
186
-
187
-
188
-
189
-
190
-
191
-
192
-
193
-
194
-
195
-
196
-
197
-
198
-
199
-
200
-
201
-
202
-
203
-
204
-
205
-
206
-
207
-
208
-
209
-
210
-
211
-
212
-
213
-
214
-
215
-
216
-
217
-
218
-
219
-
220
-
221
-
222
-
223
-
224
-
225
-
226
-
227
-
228
-
229
-
230
-
231
-
232
-
233
-
234
-
235
-
236
-
237
-
238
-
239
-
240
-
241
-
242
-
243
-
244
-
245
-
246
-
247
-
248
-
249
-
250
-
251
-
252
-
253
-
254
-
255
-
256
-
257
-
258
-
259
-
260
-
261
-
262
-
263
-
264
-
265
-
266
-
267
-
268
-
269
-
270
-
271
-
272
-
273
-
274
-
275
-
276
-
277
-
278
-
279
-
280
-
281
-
282
-
283
-
284
-
285
-
286
-
287
-
288
-
289
-
290
-
291
-
292
-
293
-
294
-
295
-
296
 |
 |

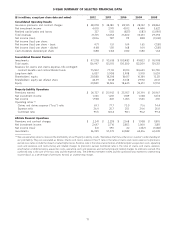
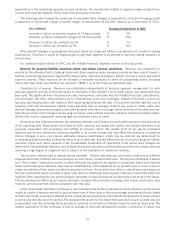
2012 HIGHLIGHTS
• Consolidated net income was $2.31 billion in 2012 compared to $787 million in 2011. Net income per diluted share
was $4.68 in 2012 compared to $1.50 in 2011.
• Property-Liability net income was $1.97 billion in 2012 compared to $403 million in 2011.
• The Property-Liability combined ratio was 95.5 in 2012 compared to 103.4 in 2011.
• Allstate Financial net income was $541 million in 2012 compared to $590 million in 2011.
• Total revenues were $33.32 billion in 2012 compared to $32.65 billion in 2011.
• Property-Liability premiums earned totaled $26.74 billion in 2012 compared to $25.94 billion in 2011.
• Investments totaled $97.28 billion as of December 31, 2012, an increase of 1.7% from $95.62 billion as of
December 31, 2011. Net investment income was $4.01 billion in 2012, an increase of 1.0% from $3.97 billion in 2011.
• Net realized capital gains were $327 million in 2012 compared to $503 million in 2011.
• Book value per diluted share (ratio of shareholders’ equity to total shares outstanding and dilutive potential shares
outstanding) was $42.39 as of December 31, 2012, an increase of 17.2% from $36.18 as of December 31, 2011.
• For the twelve months ended December 31, 2012, return on the average of beginning and ending period
shareholders’ equity was 11.9%, an increase of 7.6 points from 4.3% for the twelve months ended December 31,
2011.
• As of December 31, 2012, shareholders’ equity was $20.58 billion. This total included $2.06 billion in deployable
invested assets at the parent holding company level.
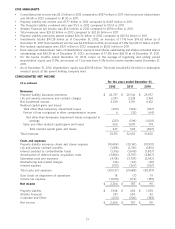
CONSOLIDATED NET INCOME
For the years ended December 31,
($ in millions)
2012 2011 2010
Revenues
Property-liability insurance premiums $ 26,737 $ 25,942 $ 25,957
Life and annuity premiums and contract charges 2,241 2,238 2,168
Net investment income 4,010 3,971 4,102
Realized capital gains and losses:
Total other-than-temporary impairment losses (239) (563) (937)
Portion of loss recognized in other comprehensive income 6 (33) (64)
Net other-than-temporary impairment losses recognized in
earnings (233) (596) (1,001)
Sales and other realized capital gains and losses 560 1,099 174
Total realized capital gains and losses 327 503 (827)
Total revenues 33,315 32,654 31,400
Costs and expenses
Property-liability insurance claims and claims expense (18,484) (20,161) (18,951)
Life and annuity contract benefits (1,818) (1,761) (1,815)
Interest credited to contractholder funds (1,316) (1,645) (1,807)
Amortization of deferred policy acquisition costs (3,884) (3,971) (3,807)
Operating costs and expenses (4,118) (3,739) (3,542)
Restructuring and related charges (34) (44) (30)
Interest expense (373) (367) (367)
Total costs and expenses (30,027) (31,688) (30,319)
Gain (loss) on disposition of operations 18 (7) 19
Income tax expense (1,000) (172) (189)
Net income $ 2,306 $ 787 $ 911
Property-Liability $ 1,968 $ 403 $ 1,053
Allstate Financial 541 590 42
Corporate and Other (203) (206) (184)
Net income $ 2,306 $ 787 $ 911
13