Allstate 2013 Annual Report Download - page 203
Download and view the complete annual report
Please find page 203 of the 2013 Allstate annual report below. You can navigate through the pages in the report by either clicking on the pages listed below, or by using the keyword search tool below to find specific information within the annual report.-
 1
1 -
2
-
3
-
4
-
5
-
6
-
7
-
8
-
9
-
10
-
11
-
12
-
13
-
14
-
15
-
16
-
17
-
18
-
19
-
20
-
21
-
22
-
23
-
24
-
25
-
26
-
27
-
28
-
29
-
30
-
31
-
32
-
33
-
34
-
35
-
36
-
37
-
38
-
39
-
40
-
41
-
42
-
43
-
44
-
45
-
46
-
47
-
48
-
49
-
50
-
51
-
52
-
53
-
54
-
55
-
56
-
57
-
58
-
59
-
60
-
61
-
62
-
63
-
64
-
65
-
66
-
67
-
68
-
69
-
70
-
71
-
72
-
73
-
74
-
75
-
76
-
77
-
78
-
79
-
80
-
81
-
82
-
83
-
84
-
85
-
86
-
87
-
88
-
89
-
90
-
91
-
92
-
93
-
94
-
95
-
96
-
97
-
98
-
99
-
100
-
101
-
102
-
103
-
104
-
105
-
106
-
107
-
108
-
109
-
110
-
111
-
112
-
113
-
114
-
115
-
116
-
117
-
118
-
119
-
120
-
121
-
122
-
123
-
124
-
125
-
126
-
127
-
128
-
129
-
130
-
131
-
132
-
133
-
134
-
135
-
136
-
137
-
138
-
139
-
140
-
141
-
142
-
143
-
144
-
145
-
146
-
147
-
148
-
149
-
150
-
151
-
152
-
153
-
154
-
155
-
156
-
157
-
158
-
159
-
160
-
161
-
162
-
163
-
164
-
165
-
166
-
167
-
168
-
169
-
170
-
171
-
172
-
173
-
174
-
175
-
176
-
177
-
178
-
179
-
180
-
181
-
182
-
183
-
184
-
185
-
186
-
187
-
188
-
189
-
190
-
191
-
192
-
 193
193 -
 194
194 -
 195
195 -
 196
196 -
 197
197 -
 198
198 -
 199
199 -
 200
200 -
 201
201 -
 202
202 -
 203
203 -
 204
204 -
 205
205 -
 206
206 -
 207
207 -
 208
208 -
 209
209 -
 210
210 -
 211
211 -
 212
212 -
 213
213 -
214
-
215
-
216
-
217
-
218
-
219
-
220
-
221
-
222
-
223
-
224
-
225
-
226
-
227
-
228
-
229
-
230
-
231
-
232
-
233
-
234
-
235
-
236
-
237
-
238
-
239
-
240
-
241
-
242
-
243
-
244
-
245
-
246
-
247
-
248
-
249
-
250
-
251
-
252
-
253
-
254
-
255
-
256
-
257
-
258
-
259
-
260
-
261
-
262
-
263
-
264
-
265
-
266
-
267
-
268
-
269
-
270
-
271
-
272
-
273
-
274
-
275
-
276
-
277
-
278
-
279
-
280
-
281
-
282
-
283
-
284
-
285
-
286
-
287
-
288
-
289
-
290
-
291
-
292
-
293
-
294
-
295
-
296
 |
 |

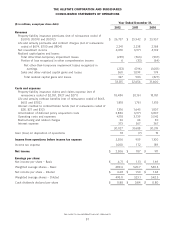
THE ALLSTATE CORPORATION AND SUBSIDIARIES
CONSOLIDATED STATEMENTS OF OPERATIONS
Year Ended December 31,
($ in millions, except per share data)
2012 2011 2010
Revenues
Property-liability insurance premiums (net of reinsurance ceded of
$1,090, $1,098 and $1,092) $ 26,737 $ 25,942 $ 25,957
Life and annuity premiums and contract charges (net of reinsurance
ceded of $674, $750 and $804) 2,241 2,238 2,168
Net investment income 4,010 3,971 4,102
Realized capital gains and losses:
Total other-than-temporary impairment losses (239) (563) (937)
Portion of loss recognized in other comprehensive income 6 (33) (64)
Net other-than-temporary impairment losses recognized in
earnings (233) (596) (1,001)
Sales and other realized capital gains and losses 560 1,099 174
Total realized capital gains and losses 327 503 (827)
33,315 32,654 31,400
Costs and expenses
Property-liability insurance claims and claims expense (net of
reinsurance ceded of $2,051, $927 and $271) 18,484 20,161 18,951
Life and annuity contract benefits (net of reinsurance ceded of $665,
$653 and $702) 1,818 1,761 1,815
Interest credited to contractholder funds (net of reinsurance ceded of
$28, $27 and $32) 1,316 1,645 1,807
Amortization of deferred policy acquisition costs 3,884 3,971 3,807
Operating costs and expenses 4,118 3,739 3,542
Restructuring and related charges 34 44 30
Interest expense 373 367 367
30,027 31,688 30,319
Gain (loss) on disposition of operations 18 (7) 19
Income from operations before income tax expense 3,306 959 1,100
Income tax expense 1,000 172 189
Net income $ 2,306 $ 787 $ 911
Earnings per share:
Net income per share – Basic $ 4.71 $ 1.51 $ 1.69
Weighted average shares – Basic 489.4 520.7 540.3
Net income per share – Diluted $ 4.68 $ 1.50 $ 1.68
Weighted average shares – Diluted 493.0 523.1 542.5
Cash dividends declared per share $ 0.88 $ 0.84 $ 0.80
See notes to consolidated financial statements.
87