Allstate 2013 Annual Report Download - page 176
Download and view the complete annual report
Please find page 176 of the 2013 Allstate annual report below. You can navigate through the pages in the report by either clicking on the pages listed below, or by using the keyword search tool below to find specific information within the annual report.-
 1
1 -
2
-
3
-
4
-
5
-
6
-
7
-
8
-
9
-
10
-
11
-
12
-
13
-
14
-
15
-
16
-
17
-
18
-
19
-
20
-
21
-
22
-
23
-
24
-
25
-
26
-
27
-
28
-
29
-
30
-
31
-
32
-
33
-
34
-
35
-
36
-
37
-
38
-
39
-
40
-
41
-
42
-
43
-
44
-
45
-
46
-
47
-
48
-
49
-
50
-
51
-
52
-
53
-
54
-
55
-
56
-
57
-
58
-
59
-
60
-
61
-
62
-
63
-
64
-
65
-
66
-
67
-
68
-
69
-
70
-
71
-
72
-
73
-
74
-
75
-
76
-
77
-
78
-
79
-
80
-
81
-
82
-
83
-
84
-
85
-
86
-
87
-
88
-
89
-
90
-
91
-
92
-
93
-
94
-
95
-
96
-
97
-
98
-
99
-
100
-
101
-
102
-
103
-
104
-
105
-
106
-
107
-
108
-
109
-
110
-
111
-
112
-
113
-
114
-
115
-
116
-
117
-
118
-
119
-
120
-
121
-
122
-
123
-
124
-
125
-
126
-
127
-
128
-
129
-
130
-
131
-
132
-
133
-
134
-
135
-
136
-
137
-
138
-
139
-
140
-
141
-
142
-
143
-
144
-
145
-
146
-
147
-
148
-
149
-
150
-
151
-
152
-
153
-
154
-
155
-
156
-
157
-
158
-
159
-
160
-
161
-
162
-
163
-
164
-
165
-
 166
166 -
 167
167 -
 168
168 -
 169
169 -
 170
170 -
 171
171 -
 172
172 -
 173
173 -
 174
174 -
 175
175 -
 176
176 -
 177
177 -
 178
178 -
 179
179 -
 180
180 -
 181
181 -
 182
182 -
 183
183 -
 184
184 -
 185
185 -
 186
186 -
187
-
188
-
189
-
190
-
191
-
192
-
193
-
194
-
195
-
196
-
197
-
198
-
199
-
200
-
201
-
202
-
203
-
204
-
205
-
206
-
207
-
208
-
209
-
210
-
211
-
212
-
213
-
214
-
215
-
216
-
217
-
218
-
219
-
220
-
221
-
222
-
223
-
224
-
225
-
226
-
227
-
228
-
229
-
230
-
231
-
232
-
233
-
234
-
235
-
236
-
237
-
238
-
239
-
240
-
241
-
242
-
243
-
244
-
245
-
246
-
247
-
248
-
249
-
250
-
251
-
252
-
253
-
254
-
255
-
256
-
257
-
258
-
259
-
260
-
261
-
262
-
263
-
264
-
265
-
266
-
267
-
268
-
269
-
270
-
271
-
272
-
273
-
274
-
275
-
276
-
277
-
278
-
279
-
280
-
281
-
282
-
283
-
284
-
285
-
286
-
287
-
288
-
289
-
290
-
291
-
292
-
293
-
294
-
295
-
296
 |
 |

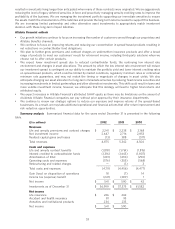
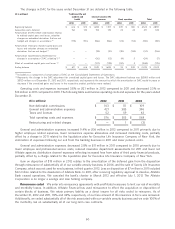
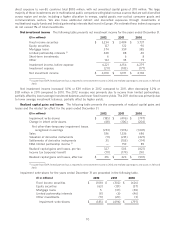
The changes in DAC for the years ended December 31 are detailed in the following table.
Traditional life and($ in millions)
accident and Interest-sensitive life
health insurance Fixed annuities Total
2012 2011 2012 2011 2012 2011 2012 2011
Beginning balance $ 616 $ 573 $ 1,698 $ 1,917 $ 209 $ 369 $ 2,523 $ 2,859
Acquisition costs deferred 154 133 192 178 25 22 371 333
Amortization of DAC before amortization relating
to realized capital gains and losses, valuation
changes on embedded derivatives that are not
hedged and changes in assumptions (1) (99) (90) (186) (186) (25) (55) (310) (331)
Amortization relating to realized capital gains and
losses and valuation changes on embedded
derivatives that are not hedged (1) — — (18) (21) (39) (135) (57) (156)
Amortization (acceleration) deceleration for
changes in assumptions (‘‘DAC unlocking’’) (1) — — (30) (12) (4) 5 (34) (7)
Effect of unrealized capital gains and losses (2) — — (127) (178) (141) 3 (268) (175)
Ending balance $ 671 $ 616 $ 1,529 $ 1,698 $ 25 $ 209 $ 2,225 $ 2,523
(1) Included as a component of amortization of DAC on the Consolidated Statements of Operations.
(2) Represents the change in the DAC adjustment for unrealized capital gains and losses. The DAC adjustment balance was $(380) million and
$(112) million as of December 31, 2012 and 2011, respectively, and represents the amount by which the amortization of DAC would increase or
decrease if the unrealized gains and losses in the respective product portfolios were realized.
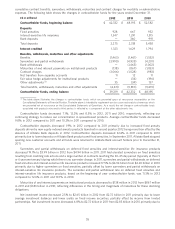
Operating costs and expenses increased 3.8% or $21 million in 2012 compared to 2011 and decreased 2.3% or
$13 million in 2011 compared to 2010. The following table summarizes operating costs and expenses for the years ended
December 31.
($ in millions) 2012 2011 2010
Non-deferrable commissions $ 103 $ 111 $ 109
General and administrative expenses 421 385 396
Taxes and licenses 52 59 63
Total operating costs and expenses $ 576 $ 555 $ 568
Restructuring and related charges $ — $ 1 $ (3)
General and administrative expenses increased 9.4% or $36 million in 2012 compared to 2011 primarily due to
higher employee related expenses, lower reinsurance expense allowances and increased marketing costs, partially
offset by a charge in 2011 related to the liquidation plan for Executive Life Insurance Company of New York, the
elimination of expenses following our exit from the banking business in 2011 and lower pension costs.
General and administrative expenses decreased 2.8% or $11 million in 2011 compared to 2010 primarily due to
lower employee and professional service costs, reduced insurance department assessments for 2011 and lower net
Allstate agencies distribution channel expenses reflecting increased fees from sales of third party financial products,
partially offset by a charge related to the liquidation plan for Executive Life Insurance Company of New York.
Gain on disposition of $18 million in 2012 relates to the amortization of the deferred gain from the disposition
through reinsurance of substantially all of our variable annuity business in 2006, and the sale of Surety Life Insurance
Company, which was not used for new business, in third quarter 2012. Loss on disposition of $7 million in 2011 included
$22 million related to the dissolution of Allstate Bank. In 2011, after receiving regulatory approval to dissolve, Allstate
Bank ceased operations. We canceled the bank’s charter in March 2012 and effective July 1, 2012 The Allstate
Corporation is no longer a savings and loan holding company.
Reinsurance ceded We enter into reinsurance agreements with unaffiliated reinsurers to limit our risk of mortality
and morbidity losses. In addition, Allstate Financial has used reinsurance to effect the acquisition or disposition of
certain blocks of business. We retain primary liability as a direct insurer for all risks ceded to reinsurers. As of
December 31, 2012 and 2011, 39% and 42%, respectively, of our face amount of life insurance in force was reinsured.
Additionally, we ceded substantially all of the risk associated with our variable annuity business and we cede 100% of
the morbidity risk on substantially all of our long-term care contracts.
60