Allstate 2013 Annual Report Download - page 186
Download and view the complete annual report
Please find page 186 of the 2013 Allstate annual report below. You can navigate through the pages in the report by either clicking on the pages listed below, or by using the keyword search tool below to find specific information within the annual report.-
 1
1 -
 2
2 -
 3
3 -
 4
4 -
 5
5 -
 6
6 -
 7
7 -
 8
8 -
 9
9 -
 10
10 -
 11
11 -
 12
12 -
 13
13 -
 14
14 -
 15
15 -
 16
16 -
 17
17 -
 18
18 -
 19
19 -
 20
20 -
 21
21 -
 22
22 -
 23
23 -
 24
24 -
 25
25 -
 26
26 -
 27
27 -
 28
28 -
 29
29 -
 30
30 -
 31
31 -
 32
32 -
 33
33 -
 34
34 -
 35
35 -
 36
36 -
 37
37 -
 38
38 -
 39
39 -
 40
40 -
 41
41 -
 42
42 -
 43
43 -
 44
44 -
 45
45 -
 46
46 -
 47
47 -
 48
48 -
 49
49 -
 50
50 -
 51
51 -
 52
52 -
 53
53 -
 54
54 -
 55
55 -
 56
56 -
 57
57 -
 58
58 -
 59
59 -
 60
60 -
 61
61 -
 62
62 -
 63
63 -
 64
64 -
 65
65 -
 66
66 -
 67
67 -
 68
68 -
 69
69 -
 70
70 -
 71
71 -
 72
72 -
 73
73 -
 74
74 -
 75
75 -
 76
76 -
 77
77 -
 78
78 -
 79
79 -
 80
80 -
 81
81 -
 82
82 -
 83
83 -
 84
84 -
 85
85 -
 86
86 -
 87
87 -
 88
88 -
 89
89 -
 90
90 -
 91
91 -
 92
92 -
 93
93 -
 94
94 -
 95
95 -
 96
96 -
 97
97 -
 98
98 -
 99
99 -
 100
100 -
 101
101 -
 102
102 -
 103
103 -
 104
104 -
 105
105 -
 106
106 -
 107
107 -
 108
108 -
 109
109 -
 110
110 -
 111
111 -
 112
112 -
 113
113 -
 114
114 -
 115
115 -
 116
116 -
 117
117 -
 118
118 -
 119
119 -
 120
120 -
 121
121 -
 122
122 -
 123
123 -
 124
124 -
 125
125 -
 126
126 -
 127
127 -
 128
128 -
 129
129 -
 130
130 -
 131
131 -
 132
132 -
 133
133 -
 134
134 -
 135
135 -
 136
136 -
 137
137 -
 138
138 -
 139
139 -
 140
140 -
 141
141 -
 142
142 -
 143
143 -
 144
144 -
 145
145 -
 146
146 -
 147
147 -
 148
148 -
 149
149 -
 150
150 -
 151
151 -
 152
152 -
 153
153 -
 154
154 -
 155
155 -
 156
156 -
 157
157 -
 158
158 -
 159
159 -
 160
160 -
 161
161 -
 162
162 -
 163
163 -
 164
164 -
 165
165 -
 166
166 -
 167
167 -
 168
168 -
 169
169 -
 170
170 -
 171
171 -
 172
172 -
 173
173 -
 174
174 -
 175
175 -
 176
176 -
 177
177 -
 178
178 -
 179
179 -
 180
180 -
 181
181 -
 182
182 -
 183
183 -
 184
184 -
 185
185 -
 186
186 -
 187
187 -
 188
188 -
 189
189 -
 190
190 -
 191
191 -
 192
192 -
 193
193 -
 194
194 -
 195
195 -
 196
196 -
 197
197 -
 198
198 -
 199
199 -
 200
200 -
 201
201 -
 202
202 -
 203
203 -
 204
204 -
 205
205 -
 206
206 -
 207
207 -
 208
208 -
 209
209 -
 210
210 -
 211
211 -
 212
212 -
 213
213 -
 214
214 -
 215
215 -
 216
216 -
 217
217 -
 218
218 -
 219
219 -
 220
220 -
 221
221 -
 222
222 -
 223
223 -
 224
224 -
 225
225 -
 226
226 -
 227
227 -
 228
228 -
 229
229 -
 230
230 -
 231
231 -
 232
232 -
 233
233 -
 234
234 -
 235
235 -
 236
236 -
 237
237 -
 238
238 -
 239
239 -
 240
240 -
 241
241 -
 242
242 -
 243
243 -
 244
244 -
 245
245 -
 246
246 -
 247
247 -
 248
248 -
 249
249 -
 250
250 -
 251
251 -
 252
252 -
 253
253 -
 254
254 -
 255
255 -
 256
256 -
 257
257 -
 258
258 -
 259
259 -
 260
260 -
 261
261 -
 262
262 -
 263
263 -
 264
264 -
 265
265 -
 266
266 -
 267
267 -
 268
268 -
 269
269 -
 270
270 -
 271
271 -
 272
272 -
 273
273 -
 274
274 -
 275
275 -
 276
276 -
 277
277 -
 278
278 -
 279
279 -
 280
280 -
 281
281 -
 282
282 -
 283
283 -
 284
284 -
 285
285 -
 286
286 -
 287
287 -
 288
288 -
 289
289 -
 290
290 -
 291
291 -
 292
292 -
 293
293 -
 294
294 -
 295
295 -
 296
296
 |
 |

direct exposure to non-EU countries total $885 million, with net unrealized capital gains of $78 million. The large
majority of these investments are in multinational public companies with global revenue sources that are well diversified
across region and sector, including a higher allocation to energy, capital goods, non-cyclical consumer goods and
communications sectors. We also have additional indirect and diversified exposures through investments in
multinational equity funds and limited partnership interests that invest in Europe. We estimate these indirect exposures
do not exceed 1% of total investments.
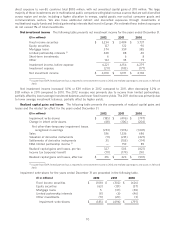
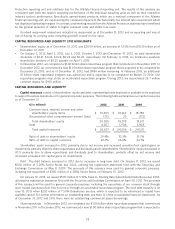
Net investment income The following table presents net investment income for the years ended December 31.
($ in millions) 2012 2011 2010
Fixed income securities $ 3,234 $ 3,484 $ 3,737
Equity securities 127 122 90
Mortgage loans 374 359 385
Limited partnership interests (1) 348 88 40
Short-term investments 6 6 8
Other 132 95 19
Investment income, before expense 4,221 4,154 4,279
Investment expense (211) (183) (177)
Net investment income $ 4,010 $ 3,971 $ 4,102
(1) Income from EMA limited partnerships is reported in net investment income in 2012 and realized capital gains and losses in 2011 and
2010.
Net investment income increased 1.0% or $39 million in 2012 compared to 2011, after decreasing 3.2% or
$131 million in 2011 compared to 2010. The 2012 increase was primarily due to income from limited partnerships,
partially offset by lower average investment balances and lower fixed income yields. The 2011 decline was primarily due
to lower average investment balances, partially offset by higher yields.
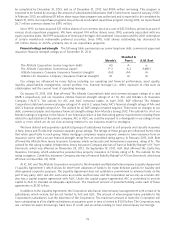
Realized capital gains and losses The following table presents the components of realized capital gains and
losses and the related tax effect for the years ended December 31.
($ in millions) 2012 2011 2010
Impairment write-downs $ (185) $ (496) $ (797)
Change in intent write-downs (48) (100) (204)
Net other-than-temporary impairment losses
recognized in earnings (233) (596) (1,001)
Sales 536 1,336 686
Valuation of derivative instruments (11) (291) (427)
Settlements of derivative instruments 35 (105) (174)
EMA limited partnership income (1) — 159 89
Realized capital gains and losses, pre-tax 327 503 (827)
Income tax (expense) benefit (111) (179) 290
Realized capital gains and losses, after-tax $ 216 $ 324 $ (537)
(1) Income from EMA limited partnerships is reported in net investment income in 2012 and realized capital gains and losses in 2011 and
2010.
Impairment write-downs for the years ended December 31 are presented in the following table.
($ in millions) 2012 2011 2010
Fixed income securities $ (108) $ (302) $ (626)
Equity securities (63) (131) (57)
Mortgage loans 5 (37) (65)
Limited partnership interests (8) (6) (46)
Other investments (11) (20) (3)
Impairment write-downs $ (185) $ (496) $ (797)
70
