Allstate 2013 Annual Report Download - page 54
Download and view the complete annual report
Please find page 54 of the 2013 Allstate annual report below. You can navigate through the pages in the report by either clicking on the pages listed below, or by using the keyword search tool below to find specific information within the annual report.-
 1
1 -
2
-
3
-
4
-
5
-
6
-
7
-
8
-
9
-
10
-
11
-
12
-
13
-
14
-
15
-
16
-
17
-
18
-
19
-
20
-
21
-
22
-
23
-
24
-
25
-
26
-
27
-
28
-
29
-
30
-
31
-
32
-
33
-
34
-
35
-
36
-
37
-
38
-
39
-
40
-
41
-
42
-
43
-
 44
44 -
 45
45 -
 46
46 -
 47
47 -
 48
48 -
 49
49 -
 50
50 -
 51
51 -
 52
52 -
 53
53 -
 54
54 -
 55
55 -
 56
56 -
 57
57 -
 58
58 -
 59
59 -
 60
60 -
 61
61 -
 62
62 -
 63
63 -
 64
64 -
65
-
66
-
67
-
68
-
69
-
70
-
71
-
72
-
73
-
74
-
75
-
76
-
77
-
78
-
79
-
80
-
81
-
82
-
83
-
84
-
85
-
86
-
87
-
88
-
89
-
90
-
91
-
92
-
93
-
94
-
95
-
96
-
97
-
98
-
99
-
100
-
101
-
102
-
103
-
104
-
105
-
106
-
107
-
108
-
109
-
110
-
111
-
112
-
113
-
114
-
115
-
116
-
117
-
118
-
119
-
120
-
121
-
122
-
123
-
124
-
125
-
126
-
127
-
128
-
129
-
130
-
131
-
132
-
133
-
134
-
135
-
136
-
137
-
138
-
139
-
140
-
141
-
142
-
143
-
144
-
145
-
146
-
147
-
148
-
149
-
150
-
151
-
152
-
153
-
154
-
155
-
156
-
157
-
158
-
159
-
160
-
161
-
162
-
163
-
164
-
165
-
166
-
167
-
168
-
169
-
170
-
171
-
172
-
173
-
174
-
175
-
176
-
177
-
178
-
179
-
180
-
181
-
182
-
183
-
184
-
185
-
186
-
187
-
188
-
189
-
190
-
191
-
192
-
193
-
194
-
195
-
196
-
197
-
198
-
199
-
200
-
201
-
202
-
203
-
204
-
205
-
206
-
207
-
208
-
209
-
210
-
211
-
212
-
213
-
214
-
215
-
216
-
217
-
218
-
219
-
220
-
221
-
222
-
223
-
224
-
225
-
226
-
227
-
228
-
229
-
230
-
231
-
232
-
233
-
234
-
235
-
236
-
237
-
238
-
239
-
240
-
241
-
242
-
243
-
244
-
245
-
246
-
247
-
248
-
249
-
250
-
251
-
252
-
253
-
254
-
255
-
256
-
257
-
258
-
259
-
260
-
261
-
262
-
263
-
264
-
265
-
266
-
267
-
268
-
269
-
270
-
271
-
272
-
273
-
274
-
275
-
276
-
277
-
278
-
279
-
280
-
281
-
282
-
283
-
284
-
285
-
286
-
287
-
288
-
289
-
290
-
291
-
292
-
293
-
294
-
295
-
296
 |
 |

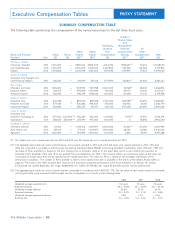
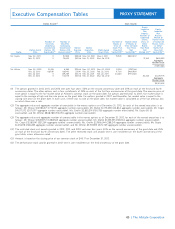
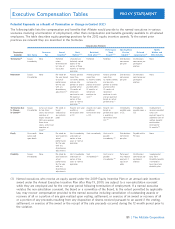
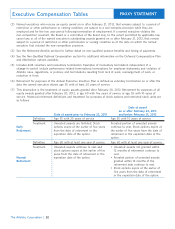
cost per flight hour is then multiplied by the flight hours flown for personal use to derive the incremental cost. This
method of calculating the incremental cost excludes fixed costs that do not change based on usage, such as pilots’
and other employees’ salaries, costs incurred in purchasing the aircraft, and non-trip related hangar expenses.
(2) Each of the named executives participated in our 401(k) plan during 2012. The amount shown is the amount
allocated to their accounts as employer matching contributions.
(3) ‘‘Other’’ consists of premiums for group life insurance and personal benefits and perquisites consisting of mobile
phones, tax preparation services, financial planning, ground transportation, supplemental long-term disability
coverage, and for Mr. Gupta, $48,132 for reimbursement of taxes related to relocation expenses. (Tax assistance for
certain relocation benefits is a standard component of our relocation program available to all employees.) Mr. Gupta
also received amounts for relocation that are not reflected in other compensation because they are part of the
standard relocation package available to all employees. There was no incremental cost for the use of mobile phones.
We provide supplemental long-term disability coverage to all regular full-time and regular part-time employees who
participate in the long-term disability plan and whose annual earnings exceed the level which produces the
maximum monthly benefit provided by the long-term disability plan. This coverage is self-insured (funded and paid
for by Allstate when obligations are incurred). No obligations for the named executives were incurred in 2012, and
therefore, no incremental cost is reflected in the table.
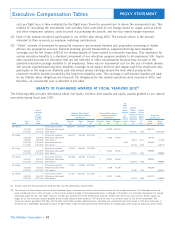
GRANTS OF PLAN-BASED AWARDS AT FISCAL YEAR-END 2012(1)
The following table provides information about non-equity incentive plan awards and equity awards granted to our named
executives during fiscal year 2012.
Mr. Wilson — — Annual cash incentive 1,650,000 3,300,000 8,500,000
3/6/2012 3/6/2012 Performance stock awards 0 124,194 248,388 3,850,014
2/21/2012 2/20/2012 Stock options 444,060 31.56 3,850,000
Mr. Shebik — — Annual cash incentive 256,033 512,065 5,527,500
3/6/2012 3/6/2012 Performance stock awards 0 9,736 19,472 301,816
3/6/2012 3/6/2012 Stock options 35,014 31.00 301,821
2/21/2012 2/20/2012 Restricted stock units 7,265 229,283
2/21/2012 2/20/2012 Stock options 26,446 31.56 229,287
Mr. Civgin — — Annual cash incentive 423,315 846,630 5,527,500
3/6/2012 3/6/2012 Performance stock awards 0 30,645 61,290 949,995
2/21/2012 2/20/2012 Stock options 109,573 31.56 949,998
Ms. Greffin — — Annual cash incentive 333,596 667,192 5,527,500
3/6/2012 3/6/2012 Performance stock awards 0 29,032 58,064 899,992
2/21/2012 2/20/2012 Stock options 103,806 31.56 899,998
Mr. Gupta — — Annual cash incentive 241,832 483,663 5,527,500
3/6/2012 3/6/2012 Performance stock awards 0 21,169 42,338 656,239
2/21/2012 2/20/2012 Stock options 75,692 31.56 656,250
Mr. Winter — — Annual cash incentive 527,164 1,054,327 5,527,500
3/6/2012 3/6/2012 Performance stock awards 0 40,323 80,646 1,250,013
2/21/2012 2/20/2012 Stock options 144,175 31.56 1,249,997
(1) Awards under the Annual Executive Incentive Plan and the 2009 Equity Incentive Plan.
(2) The amounts in these columns consist of the threshold, target, and maximum annual cash incentive awards for the named executives. The threshold amount for
each named executive is 50% of target, as the minimum amount payable if threshold performance is achieved. If threshold is not achieved, the payment to named
executives would be zero. The target amount is based upon achievement of the performance measures listed under the Annual Cash Incentive Awards caption on
pages 31-32. The maximum amount payable to any named executive who served as CFO during the year is an amount equal to 15% of the award pool. The
maximum amount payable to the CEO and the three most highly compensated executives, excluding any named executive who served as CFO during the year, is
the lesser of a stockholder approved maximum of $8.5 million under the Annual Executive Incentive Plan or a percentage, which varies by executive, of the award
42
All
Other
Stock All Other
Date of Awards: Option Exercise
Committee Number Awards: or Base
Action of Number of Price of
for Equity Shares Securities Option
Incentive of Stock Underlying Awards
Grant Plan Threshold Target Maximum Threshold Target Maximum or Units Options ($/ Stock Option
Name Date Awards Plan Name ($) ($) ($) (#) (#) (#) (#) (#) Shr)(4) Awards Awards
Executive Compensation Tables
The Allstate Corporation |
PROXY STATEMENT
Estimated Future Payouts Estimated Future Payouts
Under Non-Equity Incentive Under Equity Incentive Grant Date
Plan Awards(2) Plan Awards(3) Fair Value ($)(5)