Allstate 2013 Annual Report Download - page 152
Download and view the complete annual report
Please find page 152 of the 2013 Allstate annual report below. You can navigate through the pages in the report by either clicking on the pages listed below, or by using the keyword search tool below to find specific information within the annual report.-
 1
1 -
2
-
3
-
4
-
5
-
6
-
7
-
8
-
9
-
10
-
11
-
12
-
13
-
14
-
15
-
16
-
17
-
18
-
19
-
20
-
21
-
22
-
23
-
24
-
25
-
26
-
27
-
28
-
29
-
30
-
31
-
32
-
33
-
34
-
35
-
36
-
37
-
38
-
39
-
40
-
41
-
42
-
43
-
44
-
45
-
46
-
47
-
48
-
49
-
50
-
51
-
52
-
53
-
54
-
55
-
56
-
57
-
58
-
59
-
60
-
61
-
62
-
63
-
64
-
65
-
66
-
67
-
68
-
69
-
70
-
71
-
72
-
73
-
74
-
75
-
76
-
77
-
78
-
79
-
80
-
81
-
82
-
83
-
84
-
85
-
86
-
87
-
88
-
89
-
90
-
91
-
92
-
93
-
94
-
95
-
96
-
97
-
98
-
99
-
100
-
101
-
102
-
103
-
104
-
105
-
106
-
107
-
108
-
109
-
110
-
111
-
112
-
113
-
114
-
115
-
116
-
117
-
118
-
119
-
120
-
121
-
122
-
123
-
124
-
125
-
126
-
127
-
128
-
129
-
130
-
131
-
132
-
133
-
134
-
135
-
136
-
137
-
138
-
139
-
140
-
141
-
 142
142 -
 143
143 -
 144
144 -
 145
145 -
 146
146 -
 147
147 -
 148
148 -
 149
149 -
 150
150 -
 151
151 -
 152
152 -
 153
153 -
 154
154 -
 155
155 -
 156
156 -
 157
157 -
 158
158 -
 159
159 -
 160
160 -
 161
161 -
 162
162 -
163
-
164
-
165
-
166
-
167
-
168
-
169
-
170
-
171
-
172
-
173
-
174
-
175
-
176
-
177
-
178
-
179
-
180
-
181
-
182
-
183
-
184
-
185
-
186
-
187
-
188
-
189
-
190
-
191
-
192
-
193
-
194
-
195
-
196
-
197
-
198
-
199
-
200
-
201
-
202
-
203
-
204
-
205
-
206
-
207
-
208
-
209
-
210
-
211
-
212
-
213
-
214
-
215
-
216
-
217
-
218
-
219
-
220
-
221
-
222
-
223
-
224
-
225
-
226
-
227
-
228
-
229
-
230
-
231
-
232
-
233
-
234
-
235
-
236
-
237
-
238
-
239
-
240
-
241
-
242
-
243
-
244
-
245
-
246
-
247
-
248
-
249
-
250
-
251
-
252
-
253
-
254
-
255
-
256
-
257
-
258
-
259
-
260
-
261
-
262
-
263
-
264
-
265
-
266
-
267
-
268
-
269
-
270
-
271
-
272
-
273
-
274
-
275
-
276
-
277
-
278
-
279
-
280
-
281
-
282
-
283
-
284
-
285
-
286
-
287
-
288
-
289
-
290
-
291
-
292
-
293
-
294
-
295
-
296
 |
 |

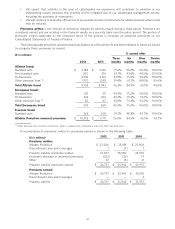
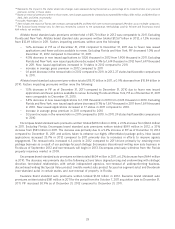
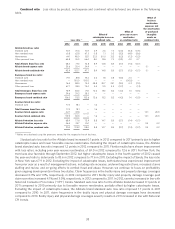
Underwriting results are shown in the following table.
($ in millions) 2012 2011 2010
Premiums written $ 27,026 $ 25,981 $ 25,906
Premiums earned $ 26,737 $ 25,942 $ 25,955
Claims and claims expense (18,433) (20,140) (18,923)
Amortization of DAC (3,483) (3,477) (3,517)
Other costs and expenses (3,534) (3,139) (2,957)
Restructuring and related charges (34) (43) (33)
Underwriting income (loss) $ 1,253 $ (857) $ 525
Catastrophe losses $ 2,345 $ 3,815 $ 2,207
Underwriting income (loss) by line of business
Standard auto $ 367 $ 561 $ 692
Non-standard auto 102 102 74
Homeowners 690 (1,331) (336)
Other personal lines 94 (189) 95
Underwriting income (loss) $ 1,253 $ (857) $ 525
Underwriting income (loss) by brand
Allstate brand $ 1,515 $ (667) $ 568
Encompass brand (70) (146) (43)
Esurance brand (192) (44) —
Underwriting income (loss) $ 1,253 $ (857) $ 525
Allstate Protection had underwriting income of $1.25 billion in 2012 compared to an underwriting loss of
$857 million in 2011, primarily due to underwriting income in homeowners and other personal lines in 2012 compared to
underwriting losses in 2011, partially offset by a decrease in standard auto underwriting income. Homeowners
underwriting income was $690 million in the 2012 compared to an underwriting loss of $1.33 billion in 2011, primarily
due to decreases in catastrophe losses and average earned premiums increasing faster than loss costs, partially offset
by higher expenses. Other personal lines underwriting income was $94 million in 2012 compared to an underwriting
loss of $189 million in 2011, primarily due to decreases in catastrophe losses including favorable reserve reestimates.
Standard auto underwriting income decreased $194 million to $367 million in 2012 from $561 million in 2011 primarily
due to the inclusion of a full year of Esurance brand’s underwriting losses in 2012 and increases in catastrophe losses.
Allstate Protection experienced an underwriting loss of $857 million in 2011 compared to underwriting income of
$525 million in 2010, primarily due to an increase in homeowners underwriting loss, an underwriting loss for other
personal lines in 2011 compared to an underwriting gain in 2010, and a decrease in standard auto underwriting income.
Homeowners underwriting loss increased $995 million to $1.33 billion in 2011 from $336 million in 2010, primarily due
to increases in catastrophe losses and higher expenses partially offset by average earned premiums increasing faster
than loss costs. Other personal lines underwriting income decreased $284 million to an underwriting loss of
$189 million in 2011 from underwriting income of $95 million in 2010, primarily due to increases in catastrophe losses,
unfavorable reserve reestimates and higher expenses. Standard auto underwriting income decreased $131 million to
$561 million in 2011 from $692 million in 2010, primarily due to increases in catastrophe losses and higher expenses,
partially offset by favorable reserve reestimates.
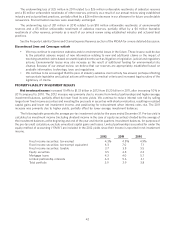
Catastrophe losses were $2.35 billion in 2012 compared to $3.82 billion in 2011 and $2.21 billion in 2010.
$1.12 billion of the 2012 catastrophe losses related to Sandy, comprising approximately 179,000 expected claims of
which approximately 170,000 claims have been reported. Through February 4, 2013, approximately 98% of the
property and auto claim counts related to Sandy are closed and approximately 95% of our expected net losses have
been paid. We expect substantially all of our remaining estimated net losses related to Sandy to be paid during 2013.
2012 catastrophe losses also include $8 million of accelerated and reinstatement catastrophe reinsurance premiums
incurred as a result of Sandy.
We define a ‘‘catastrophe’’ as an event that produces pre-tax losses before reinsurance in excess of $1 million and
involves multiple first party policyholders, or an event that produces a number of claims in excess of a preset, per-event
threshold of average claims in a specific area, occurring within a certain amount of time following the event.
36