Allstate 2013 Annual Report Download - page 207
Download and view the complete annual report
Please find page 207 of the 2013 Allstate annual report below. You can navigate through the pages in the report by either clicking on the pages listed below, or by using the keyword search tool below to find specific information within the annual report.-
 1
1 -
2
-
3
-
4
-
5
-
6
-
7
-
8
-
9
-
10
-
11
-
12
-
13
-
14
-
15
-
16
-
17
-
18
-
19
-
20
-
21
-
22
-
23
-
24
-
25
-
26
-
27
-
28
-
29
-
30
-
31
-
32
-
33
-
34
-
35
-
36
-
37
-
38
-
39
-
40
-
41
-
42
-
43
-
44
-
45
-
46
-
47
-
48
-
49
-
50
-
51
-
52
-
53
-
54
-
55
-
56
-
57
-
58
-
59
-
60
-
61
-
62
-
63
-
64
-
65
-
66
-
67
-
68
-
69
-
70
-
71
-
72
-
73
-
74
-
75
-
76
-
77
-
78
-
79
-
80
-
81
-
82
-
83
-
84
-
85
-
86
-
87
-
88
-
89
-
90
-
91
-
92
-
93
-
94
-
95
-
96
-
97
-
98
-
99
-
100
-
101
-
102
-
103
-
104
-
105
-
106
-
107
-
108
-
109
-
110
-
111
-
112
-
113
-
114
-
115
-
116
-
117
-
118
-
119
-
120
-
121
-
122
-
123
-
124
-
125
-
126
-
127
-
128
-
129
-
130
-
131
-
132
-
133
-
134
-
135
-
136
-
137
-
138
-
139
-
140
-
141
-
142
-
143
-
144
-
145
-
146
-
147
-
148
-
149
-
150
-
151
-
152
-
153
-
154
-
155
-
156
-
157
-
158
-
159
-
160
-
161
-
162
-
163
-
164
-
165
-
166
-
167
-
168
-
169
-
170
-
171
-
172
-
173
-
174
-
175
-
176
-
177
-
178
-
179
-
180
-
181
-
182
-
183
-
184
-
185
-
186
-
187
-
188
-
189
-
190
-
191
-
192
-
193
-
194
-
195
-
196
-
 197
197 -
 198
198 -
 199
199 -
 200
200 -
 201
201 -
 202
202 -
 203
203 -
 204
204 -
 205
205 -
 206
206 -
 207
207 -
 208
208 -
 209
209 -
 210
210 -
 211
211 -
 212
212 -
 213
213 -
 214
214 -
 215
215 -
 216
216 -
 217
217 -
218
-
219
-
220
-
221
-
222
-
223
-
224
-
225
-
226
-
227
-
228
-
229
-
230
-
231
-
232
-
233
-
234
-
235
-
236
-
237
-
238
-
239
-
240
-
241
-
242
-
243
-
244
-
245
-
246
-
247
-
248
-
249
-
250
-
251
-
252
-
253
-
254
-
255
-
256
-
257
-
258
-
259
-
260
-
261
-
262
-
263
-
264
-
265
-
266
-
267
-
268
-
269
-
270
-
271
-
272
-
273
-
274
-
275
-
276
-
277
-
278
-
279
-
280
-
281
-
282
-
283
-
284
-
285
-
286
-
287
-
288
-
289
-
290
-
291
-
292
-
293
-
294
-
295
-
296
 |
 |

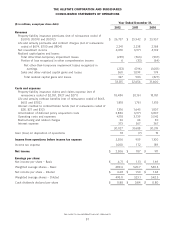
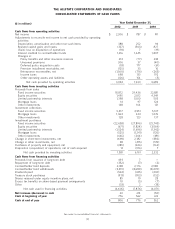
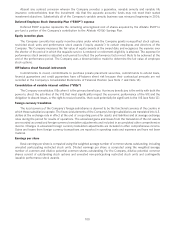
THE ALLSTATE CORPORATION AND SUBSIDIARIES
CONSOLIDATED STATEMENTS OF CASH FLOWS
Year Ended December 31,
($ in millions)
2012 2011 2010
Cash flows from operating activities
Net income $ 2,306 $ 787 $ 911
Adjustments to reconcile net income to net cash provided by operating
activities:
Depreciation, amortization and other non-cash items 388 252 94
Realized capital gains and losses (327) (503) 827
(Gain) loss on disposition of operations (18) 7 (19)
Interest credited to contractholder funds 1,316 1,645 1,807
Changes in:
Policy benefits and other insurance reserves 214 (77) 238
Unearned premiums 306 37 (40)
Deferred policy acquisition costs (18) 177 (61)
Premium installment receivables, net (125) 33 10
Reinsurance recoverables, net (1,560) (716) (265)
Income taxes 698 133 192
Other operating assets and liabilities (126) 154 (5)
Net cash provided by operating activities 3,054 1,929 3,689
Cash flows from investing activities
Proceeds from sales
Fixed income securities 18,872 29,436 22,881
Equity securities 1,495 2,012 4,349
Limited partnership interests 1,398 1,000 505
Mortgage loans 14 97 124
Other investments 148 164 121
Investment collections
Fixed income securities 5,417 4,951 5,147
Mortgage loans 1,064 634 1,076
Other investments 128 123 137
Investment purchases
Fixed income securities (22,658) (27,896) (25,745)
Equity securities (671) (1,824) (3,564)
Limited partnership interests (1,524) (1,696) (1,342)
Mortgage loans (525) (1,241) (120)
Other investments (665) (204) (181)
Change in short-term investments, net (698) 2,182 (382)
Change in other investments, net 58 (415) (519)
Purchases of property and equipment, net (285) (246) (162)
Disposition (acquisition) of operations, net of cash acquired 13 (916) 7
Net cash provided by investing activities 1,581 6,161 2,332
Cash flows from financing activities
Proceeds from issuance of long-term debt 493 7 —
Repayment of long-term debt (352) (7) (2)
Contractholder fund deposits 2,158 2,176 2,980
Contractholder fund withdrawals (5,519) (8,680) (8,470)
Dividends paid (534) (435) (430)
Treasury stock purchases (913) (953) (152)
Shares reissued under equity incentive plans, net 85 19 28
Excess tax benefits on share-based payment arrangements 10 (5) (7)
Other (33) 2 (18)
Net cash used in financing activities (4,605) (7,876) (6,071)
Net increase (decrease) in cash 30 214 (50)
Cash at beginning of year 776 562 612
Cash at end of year $ 806 $ 776 $ 562
See notes to consolidated financial statements.
91