Allstate 2013 Annual Report Download - page 164
Download and view the complete annual report
Please find page 164 of the 2013 Allstate annual report below. You can navigate through the pages in the report by either clicking on the pages listed below, or by using the keyword search tool below to find specific information within the annual report.-
 1
1 -
2
-
3
-
4
-
5
-
6
-
7
-
8
-
9
-
10
-
11
-
12
-
13
-
14
-
15
-
16
-
17
-
18
-
19
-
20
-
21
-
22
-
23
-
24
-
25
-
26
-
27
-
28
-
29
-
30
-
31
-
32
-
33
-
34
-
35
-
36
-
37
-
38
-
39
-
40
-
41
-
42
-
43
-
44
-
45
-
46
-
47
-
48
-
49
-
50
-
51
-
52
-
53
-
54
-
55
-
56
-
57
-
58
-
59
-
60
-
61
-
62
-
63
-
64
-
65
-
66
-
67
-
68
-
69
-
70
-
71
-
72
-
73
-
74
-
75
-
76
-
77
-
78
-
79
-
80
-
81
-
82
-
83
-
84
-
85
-
86
-
87
-
88
-
89
-
90
-
91
-
92
-
93
-
94
-
95
-
96
-
97
-
98
-
99
-
100
-
101
-
102
-
103
-
104
-
105
-
106
-
107
-
108
-
109
-
110
-
111
-
112
-
113
-
114
-
115
-
116
-
117
-
118
-
119
-
120
-
121
-
122
-
123
-
124
-
125
-
126
-
127
-
128
-
129
-
130
-
131
-
132
-
133
-
134
-
135
-
136
-
137
-
138
-
139
-
140
-
141
-
142
-
143
-
144
-
145
-
146
-
147
-
148
-
149
-
150
-
151
-
152
-
153
-
 154
154 -
 155
155 -
 156
156 -
 157
157 -
 158
158 -
 159
159 -
 160
160 -
 161
161 -
 162
162 -
 163
163 -
 164
164 -
 165
165 -
 166
166 -
 167
167 -
 168
168 -
 169
169 -
 170
170 -
 171
171 -
 172
172 -
 173
173 -
 174
174 -
175
-
176
-
177
-
178
-
179
-
180
-
181
-
182
-
183
-
184
-
185
-
186
-
187
-
188
-
189
-
190
-
191
-
192
-
193
-
194
-
195
-
196
-
197
-
198
-
199
-
200
-
201
-
202
-
203
-
204
-
205
-
206
-
207
-
208
-
209
-
210
-
211
-
212
-
213
-
214
-
215
-
216
-
217
-
218
-
219
-
220
-
221
-
222
-
223
-
224
-
225
-
226
-
227
-
228
-
229
-
230
-
231
-
232
-
233
-
234
-
235
-
236
-
237
-
238
-
239
-
240
-
241
-
242
-
243
-
244
-
245
-
246
-
247
-
248
-
249
-
250
-
251
-
252
-
253
-
254
-
255
-
256
-
257
-
258
-
259
-
260
-
261
-
262
-
263
-
264
-
265
-
266
-
267
-
268
-
269
-
270
-
271
-
272
-
273
-
274
-
275
-
276
-
277
-
278
-
279
-
280
-
281
-
282
-
283
-
284
-
285
-
286
-
287
-
288
-
289
-
290
-
291
-
292
-
293
-
294
-
295
-
296
 |
 |

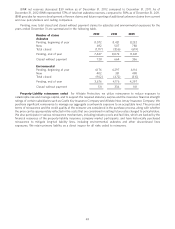
were primarily related to site-specific remediations where the clean-up cost estimates and responsibility for the
clean-up were more fully determined.
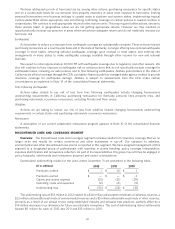
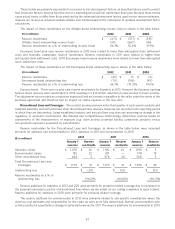
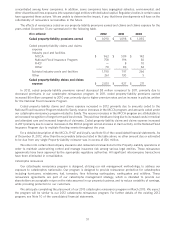
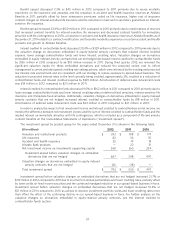
The table below summarizes reserves and claim activity for asbestos and environmental claims before (Gross) and
after (Net) the effects of reinsurance for the past three years.
2012 2011 2010
($ in millions, except ratios)
Gross Net Gross Net Gross Net
Asbestos claims
Beginning reserves $ 1,607 $ 1,078 $ 1,655 $ 1,100 $ 1,780 $ 1,180
Incurred claims and claims expense 34 26 38 26 (7) 5
Claims and claims expense paid (119) (78) (86) (48) (118) (85)
Ending reserves $ 1,522 $ 1,026 $ 1,607 $ 1,078 $ 1,655 $ 1,100
Annual survival ratio 12.8 13.2 18.7 22.5 14.0 12.9
3-year survival ratio 14.1 14.7 13.6 13.6 12.6 12.2
Environmental claims
Beginning reserves $ 225 $ 185 $ 248 $ 201 $ 247 $ 198
Incurred claims and claims expense 32 22 (2) — 19 18
Claims and claims expense paid (16) (14) (21) (16) (18) (15)
Ending reserves $ 241 $ 193 $ 225 $ 185 $ 248 $ 201
Annual survival ratio 15.1 13.8 10.7 11.6 13.8 13.4
3-year survival ratio 13.4 12.9 11.8 11.6 8.0 8.7
Combined environmental and asbestos claims
Annual survival ratio 13.1 13.3 17.1 19.7 14.0 13.0
3-year survival ratio 14.0 14.3 13.4 13.3 11.7 11.6
Percentage of IBNR in ending reserves 57.8% 59.0% 60.1%
The survival ratio is calculated by taking our ending reserves divided by payments made during the year. This is a
commonly used but extremely simplistic and imprecise approach to measuring the adequacy of asbestos and
environmental reserve levels. Many factors, such as mix of business, level of coverage provided and settlement
procedures have significant impacts on the amount of environmental and asbestos claims and claims expense reserves,
claim payments and the resultant ratio. As payments result in corresponding reserve reductions, survival ratios can be
expected to vary over time.
In both 2012 and 2011, the asbestos net 3-year survival ratio increased due to lower average annual payments. The
environmental net 3-year survival ratio increased in both 2012 and 2011 due to lower average annual payments.
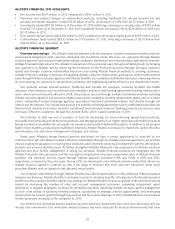
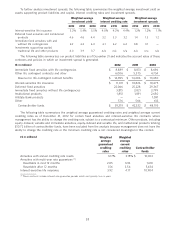
Our net asbestos reserves by type of exposure and total reserve additions are shown in the following table.
December 31, 2012 December 31, 2011 December 31, 2010
($ in millions)
Active Active Active
policy- Net % of policy- Net % of policy- Net % of
holders reserves reserves holders reserves reserves holders reserves reserves
Direct policyholders:
Primary 54 $ 12 1% 52 $ 17 2% 51 $ 17 1%
Excess 299 276 27 314 263 24 319 261 24
Total 353 288 28 366 280 26 370 278 25
Assumed reinsurance 150 15 171 16 165 15
IBNR 588 57 627 58 657 60
Total net reserves $ 1,026 100% $ 1,078 100% $ 1,100 100%
Total reserve additions $ 26 $ 26 $ 5
During the last three years, 52 direct primary and excess policyholders reported new claims, and claims of 68
policyholders were closed, decreasing the number of active policyholders by 16 during the period. The 16 decrease
comprised (13) from 2012, (4) from 2011 and 1 from 2010. The decrease of 13 in 2012 included 15 new policyholders
reporting new claims and the closing of 28 policyholders’ claims.
48