Allstate 2013 Annual Report Download - page 45
Download and view the complete annual report
Please find page 45 of the 2013 Allstate annual report below. You can navigate through the pages in the report by either clicking on the pages listed below, or by using the keyword search tool below to find specific information within the annual report.-
 1
1 -
2
-
3
-
4
-
5
-
6
-
7
-
8
-
9
-
10
-
11
-
12
-
13
-
14
-
15
-
16
-
17
-
18
-
19
-
20
-
21
-
22
-
23
-
24
-
25
-
26
-
27
-
28
-
29
-
30
-
31
-
32
-
33
-
34
-
 35
35 -
 36
36 -
 37
37 -
 38
38 -
 39
39 -
 40
40 -
 41
41 -
 42
42 -
 43
43 -
 44
44 -
 45
45 -
 46
46 -
 47
47 -
 48
48 -
 49
49 -
 50
50 -
 51
51 -
 52
52 -
 53
53 -
 54
54 -
 55
55 -
56
-
57
-
58
-
59
-
60
-
61
-
62
-
63
-
64
-
65
-
66
-
67
-
68
-
69
-
70
-
71
-
72
-
73
-
74
-
75
-
76
-
77
-
78
-
79
-
80
-
81
-
82
-
83
-
84
-
85
-
86
-
87
-
88
-
89
-
90
-
91
-
92
-
93
-
94
-
95
-
96
-
97
-
98
-
99
-
100
-
101
-
102
-
103
-
104
-
105
-
106
-
107
-
108
-
109
-
110
-
111
-
112
-
113
-
114
-
115
-
116
-
117
-
118
-
119
-
120
-
121
-
122
-
123
-
124
-
125
-
126
-
127
-
128
-
129
-
130
-
131
-
132
-
133
-
134
-
135
-
136
-
137
-
138
-
139
-
140
-
141
-
142
-
143
-
144
-
145
-
146
-
147
-
148
-
149
-
150
-
151
-
152
-
153
-
154
-
155
-
156
-
157
-
158
-
159
-
160
-
161
-
162
-
163
-
164
-
165
-
166
-
167
-
168
-
169
-
170
-
171
-
172
-
173
-
174
-
175
-
176
-
177
-
178
-
179
-
180
-
181
-
182
-
183
-
184
-
185
-
186
-
187
-
188
-
189
-
190
-
191
-
192
-
193
-
194
-
195
-
196
-
197
-
198
-
199
-
200
-
201
-
202
-
203
-
204
-
205
-
206
-
207
-
208
-
209
-
210
-
211
-
212
-
213
-
214
-
215
-
216
-
217
-
218
-
219
-
220
-
221
-
222
-
223
-
224
-
225
-
226
-
227
-
228
-
229
-
230
-
231
-
232
-
233
-
234
-
235
-
236
-
237
-
238
-
239
-
240
-
241
-
242
-
243
-
244
-
245
-
246
-
247
-
248
-
249
-
250
-
251
-
252
-
253
-
254
-
255
-
256
-
257
-
258
-
259
-
260
-
261
-
262
-
263
-
264
-
265
-
266
-
267
-
268
-
269
-
270
-
271
-
272
-
273
-
274
-
275
-
276
-
277
-
278
-
279
-
280
-
281
-
282
-
283
-
284
-
285
-
286
-
287
-
288
-
289
-
290
-
291
-
292
-
293
-
294
-
295
-
296
 |
 |

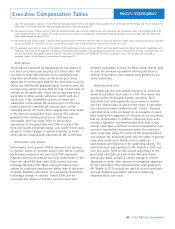
22MAR201312074755
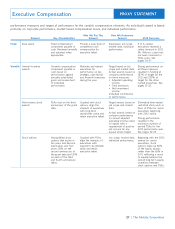
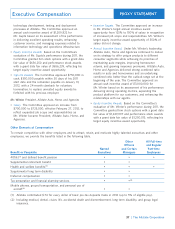
Adjusted Operating Income ROE as the performance Performance is measured in three separate one-year
measure because it — periods. The actual number of PSAs earned for each
measurement period varies from 0% to 200% of that
• Captures both income and balance sheet impacts, period’s target PSAs based on Adjusted Operating Income
including capital management actions. ROE for the period. The measurement periods and levels
• Provides a useful gauge of overall performance while of Adjusted Operating Income ROE needed to earn the
limiting the effects of extreme weather conditions and threshold, target, and maximum number of PSAs for the
other items that management cannot influence. measurement period are set forth in the table below. The
annually increasing performance goals and a 13%
• Measures performance in a way that is tracked and maximum in 2014 are consistent with the corporation’s
understood by investors. return objectives and recognize the inherent earnings
• Correlates to changes in long-term stockholder value. volatility of Allstate’s business.
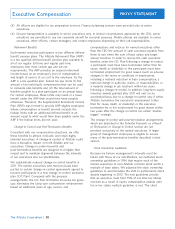
4.0% 10.0% 11.5% 12.3%
4.5% 10.5% 12.25% To be determined 2014
5.0% 11.0% 13.0% To be determined 2015
0% 100% 200%
Subject to
positive net
income hurdle
The Committee included a requirement of positive net measurement period. PSAs earned will vest following the
income in order to earn PSAs based on Adjusted end of the three year performance cycle, subject to
Operating Income ROE above target. In the event of a net continued employment (other than in the event of death,
loss in a measurement period, the number of PSAs earned disability, retirement, or a qualifying termination following
would be limited to target, regardless of the Adjusted a change in control).
Operating Income ROE. This hurdle was included to Based on our Adjusted Operating Income ROE of 12.3%
prevent misalignment between Allstate reported net for 2012, 200% of the target number of PSAs for the
income and the PSAs earned based on the Adjusted 2012 measurement period were earned by our named
Operating Income ROE result. This situation could occur if executives and will be received on the conversion date in
catastrophe losses or investment losses that are not 2015, subject to continued employment (other than in the
included in Adjusted Operating Income ROE caused event of death, disability, retirement, or a qualifying
Allstate to report a net loss for the period. termination following a change in control). The following
At the end of each measurement period, the Committee table shows the target number of PSAs granted to each of
certifies the level of our Adjusted Operating Income ROE our named executives for the 2012-2014 performance
achievement, as well as the resulting number of PSAs cycle, the target number of PSAs for the 2012
earned by each named executive for that measurement measurement period, and the number of PSAs earned
period. The Committee does not have the discretion to based on achievement of the performance measure.
adjust the performance achievement upward for any
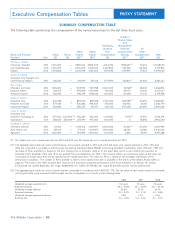
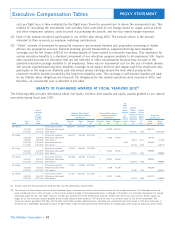
33
Executive Compensation
2012-2014 Performance Stock Awards Ranges of Performance
Annual Adjusted Operating
Income Return on Equity Threshold Target Maximum Actual Results
Measurement Period 2012
Measurement Period 2013
Measurement Period 2014
Payout
| The Allstate Corporation
PROXY STATEMENT