Allstate 2013 Annual Report Download - page 115
Download and view the complete annual report
Please find page 115 of the 2013 Allstate annual report below. You can navigate through the pages in the report by either clicking on the pages listed below, or by using the keyword search tool below to find specific information within the annual report.-
 1
1 -
2
-
3
-
4
-
5
-
6
-
7
-
8
-
9
-
10
-
11
-
12
-
13
-
14
-
15
-
16
-
17
-
18
-
19
-
20
-
21
-
22
-
23
-
24
-
25
-
26
-
27
-
28
-
29
-
30
-
31
-
32
-
33
-
34
-
35
-
36
-
37
-
38
-
39
-
40
-
41
-
42
-
43
-
44
-
45
-
46
-
47
-
48
-
49
-
50
-
51
-
52
-
53
-
54
-
55
-
56
-
57
-
58
-
59
-
60
-
61
-
62
-
63
-
64
-
65
-
66
-
67
-
68
-
69
-
70
-
71
-
72
-
73
-
74
-
75
-
76
-
77
-
78
-
79
-
80
-
81
-
82
-
83
-
84
-
85
-
86
-
87
-
88
-
89
-
90
-
91
-
92
-
93
-
94
-
95
-
96
-
97
-
98
-
99
-
100
-
101
-
102
-
103
-
104
-
 105
105 -
 106
106 -
 107
107 -
 108
108 -
 109
109 -
 110
110 -
 111
111 -
 112
112 -
 113
113 -
 114
114 -
 115
115 -
 116
116 -
 117
117 -
 118
118 -
 119
119 -
 120
120 -
 121
121 -
 122
122 -
 123
123 -
 124
124 -
 125
125 -
126
-
127
-
128
-
129
-
130
-
131
-
132
-
133
-
134
-
135
-
136
-
137
-
138
-
139
-
140
-
141
-
142
-
143
-
144
-
145
-
146
-
147
-
148
-
149
-
150
-
151
-
152
-
153
-
154
-
155
-
156
-
157
-
158
-
159
-
160
-
161
-
162
-
163
-
164
-
165
-
166
-
167
-
168
-
169
-
170
-
171
-
172
-
173
-
174
-
175
-
176
-
177
-
178
-
179
-
180
-
181
-
182
-
183
-
184
-
185
-
186
-
187
-
188
-
189
-
190
-
191
-
192
-
193
-
194
-
195
-
196
-
197
-
198
-
199
-
200
-
201
-
202
-
203
-
204
-
205
-
206
-
207
-
208
-
209
-
210
-
211
-
212
-
213
-
214
-
215
-
216
-
217
-
218
-
219
-
220
-
221
-
222
-
223
-
224
-
225
-
226
-
227
-
228
-
229
-
230
-
231
-
232
-
233
-
234
-
235
-
236
-
237
-
238
-
239
-
240
-
241
-
242
-
243
-
244
-
245
-
246
-
247
-
248
-
249
-
250
-
251
-
252
-
253
-
254
-
255
-
256
-
257
-
258
-
259
-
260
-
261
-
262
-
263
-
264
-
265
-
266
-
267
-
268
-
269
-
270
-
271
-
272
-
273
-
274
-
275
-
276
-
277
-
278
-
279
-
280
-
281
-
282
-
283
-
284
-
285
-
286
-
287
-
288
-
289
-
290
-
291
-
292
-
293
-
294
-
295
-
296
 |
 |

securities, and by including them in operating income, we are appropriately reflecting their trends in our performance
and in a manner consistent with the economically hedged investments, product attributes (e.g. net investment income
and interest credited to contractholder funds) or replicated investments. Business combination expenses are excluded
because they are non-recurring in nature and the amortization of purchased intangible assets is excluded because it
relates to the acquisition purchase price and is not indicative of our underlying insurance business results or trends.
Non-recurring items are excluded because, by their nature, they are not indicative of our business or economic trends.
Accordingly, operating income excludes the effect of items that tend to be highly variable from period to period and
highlights the results from ongoing operations and the underlying profitability of our business. A byproduct of excluding
these items to determine operating income is the transparency and understanding of their significance to net income
variability and profitability while recognizing these or similar items may recur in subsequent periods. Operating income
is used by management along with the other components of net income (loss) to assess our performance. We use
adjusted measures of operating income and operating income per diluted share in incentive compensation. Therefore,
we believe it is useful for investors to evaluate net income (loss), operating income and their components separately and
in the aggregate when reviewing and evaluating our performance. We note that investors, financial analysts, financial
and business media organizations and rating agencies utilize operating income results in their evaluation of our and our
industry’s financial performance and in their investment decisions, recommendations and communications as it
represents a reliable, representative and consistent measurement of the industry and the company and management’s
performance. We note that the price to earnings multiple commonly used by insurance investors as a forward-looking
valuation technique uses operating income as the denominator. Operating income should not be considered as a
substitute for net income (loss) and does not reflect the overall profitability of our business.
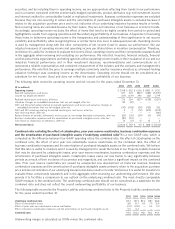
The following table reconciles operating income and net income for the years ended December 31.
2012 2011 2010 2009 2008
($ in millions)
Operating income $ 2,148 $ 662 $ 1,506 $ 1,880 $ 1,730
Realized capital gains and losses 327 503 (827) (583) (5,090)
Income tax (expense) benefit (111) (179) 290 (45) 1,779
Realized capital gains and losses, after-tax 216 324 (537) (628) (3,311)
Valuation changes on embedded derivatives that are not hedged, after-tax 82 (12) — — —
DAC and DSI amortization relating to realized capital gains and losses and valuation changes on
embedded derivatives that are not hedged, after-tax (42) (108) (29) (153) 333
DAC and DSI unlocking relating to realized capital gains and losses, after-tax 4 3 (12) (219) (203)
Non-recurring items, after-tax — — — — (80)
Reclassification of periodic settlements and accruals on non-hedge derivative instruments, after-tax (33) (35) (29) (2) (14)
Business combination expenses and the amortization of purchased intangible assets, after-tax (81) (42) — — —
Gain (loss) on disposition of operations, after tax 12 (5) 12 10 3
Net income (loss) $ 2,306 $ 787 $ 911 $ 888 $ (1,542)
Combined ratio excluding the effect of catastrophes, prior year reserve reestimates, business combination expenses
and the amortization of purchased intangible assets (‘‘underlying combined ratio’’) is a non-GAAP ratio, which is
computed as the difference between four GAAP operating ratios: the combined ratio, the effect of catastrophes on the
combined ratio, the effect of prior year non-catastrophe reserve reestimates on the combined ratio, the effect of
business combination expenses and the amortization of purchased intangible assets on the combined ratio. We believe
that this ratio is useful to investors and it is used by management to reveal the trends in our Property-Liability business
that may be obscured by catastrophe losses, prior year reserve reestimates, business combination expenses and the
amortization of purchased intangible assets. Catastrophe losses cause our loss trends to vary significantly between
periods as a result of their incidence of occurrence and magnitude, and can have a significant impact on the combined
ratio. Prior year reserve reestimates are caused by unexpected loss development on historical reserves. Business
combination expenses and the amortization of purchased intangible assets primarily relate to the acquisition purchase
price and are not indicative of our underlying insurance business results or trends. We believe it is useful for investors to
evaluate these components separately and in the aggregate when reviewing our underwriting performance. We also
provide it to facilitate a comparison to our outlook on the underlying combined ratio. The most directly comparable
GAAP measure is the combined ratio. The underlying combined ratio should not be considered as a substitute for the
combined ratio and does not reflect the overall underwriting profitability of our business.
The following table reconciles the Property-Liability underlying combined ratio to the Property-Liability combined ratio
for the years ended December 31.
2012 2011 2010 2009 2008
Underlying combined ratio 87.2 89.3 89.6 88.1 86.8
Effect of catastrophe losses 8.8 14.7 8.5 7.9 12.4
Effect of prior year non-catastrophe reserve reestimates (1.0) (0.8) — 0.2 0.2
Effect of business combination expenses and the amortization of purchased intangible assets 0.5 0.2 — — —
Combined ratio 95.5 103.4 98.1 96.2 99.4
Underwriting margin is calculated as 100% minus the combined ratio.